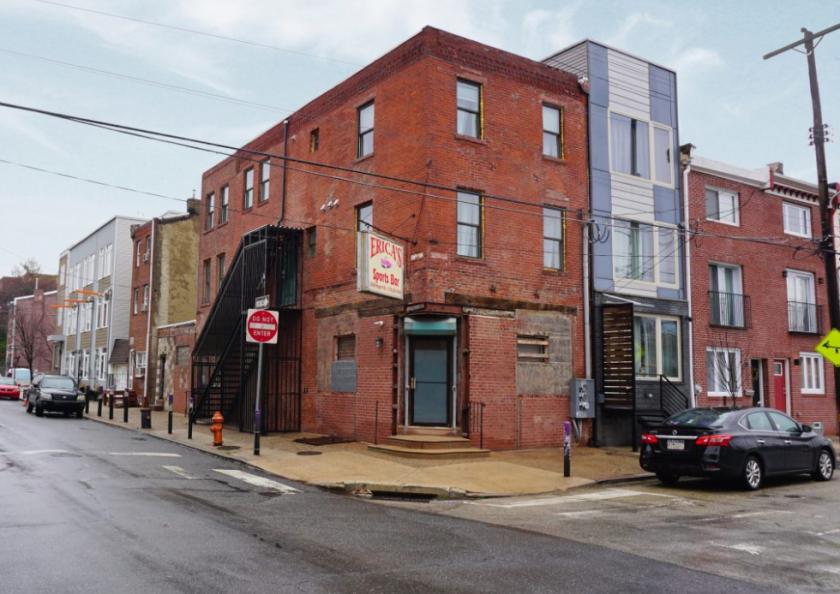
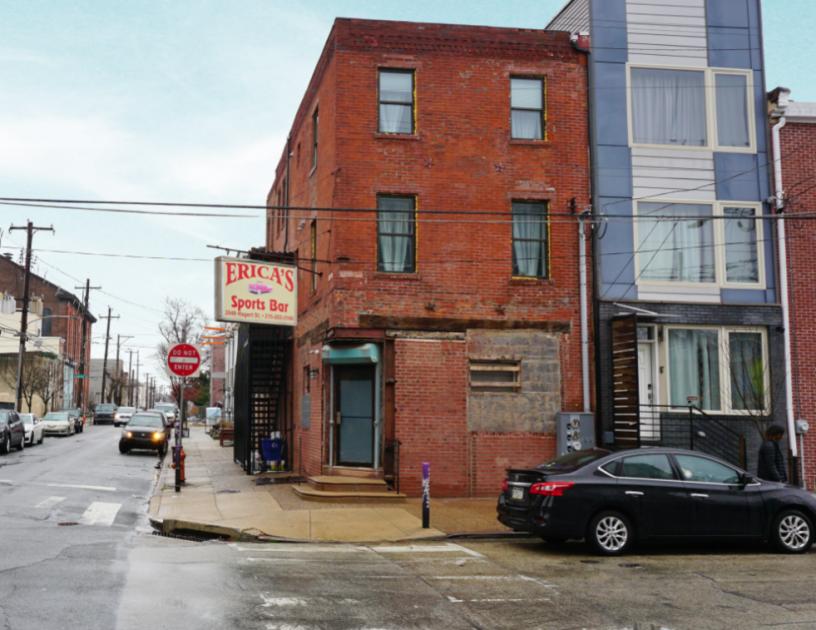
Retail Space
2049 East Hagert Street Philadelphia, PA 19125
2049 East Hagert Street Philadelphia, PA 19125
Details & Description
Property Highlights
- • Ideal for cafe, barrestaurant or bottle shop
- • R Liquor license available with new lease
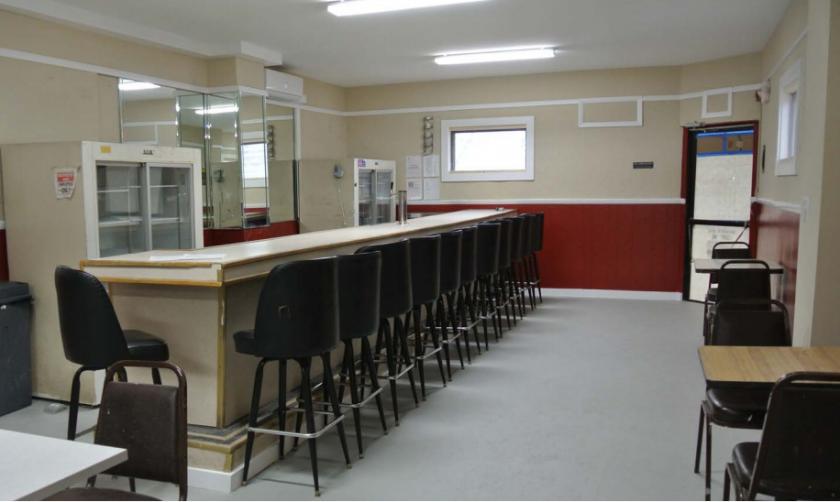
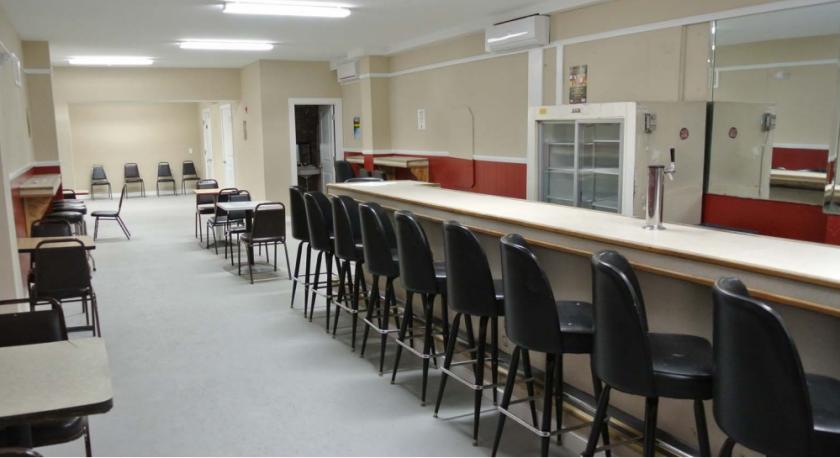
- • Original bar, bathroom walk-in all in place
Additional Photos

Listing Agents

Vincent Stipo
O: 215-883-7399
vstipo@hellomsc.com
O: 215-883-7399
vstipo@hellomsc.com

Leah Sweitzer
MSC
O: 310-622-4532
lsweitzer@hellomsc.com
MSC
O: 310-622-4532
lsweitzer@hellomsc.com
While we strive to provide the most accurate information, all listing information, and demographic data, is provided by third-parties. As such, MyEListing will not be responsible for the accuracy of the information. It is strongly recommended that you verify all information with the listing agent, and any relevant agencies, prior to making any decisions.


