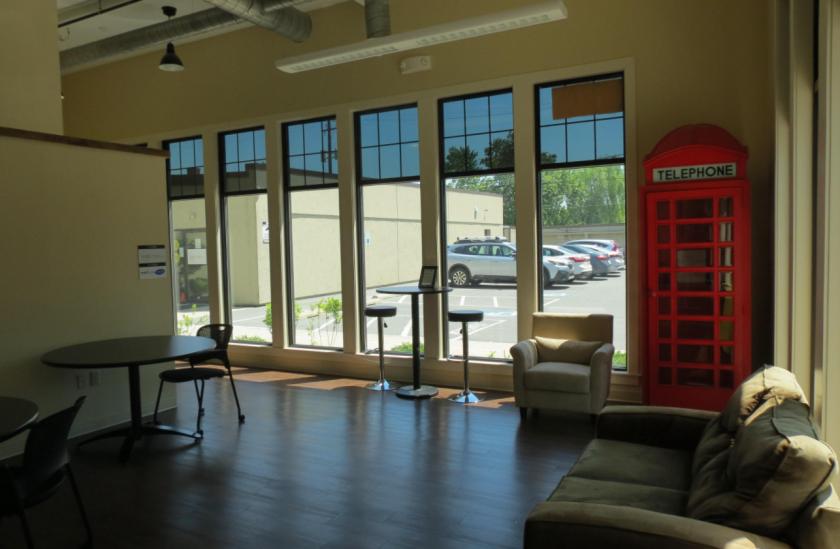
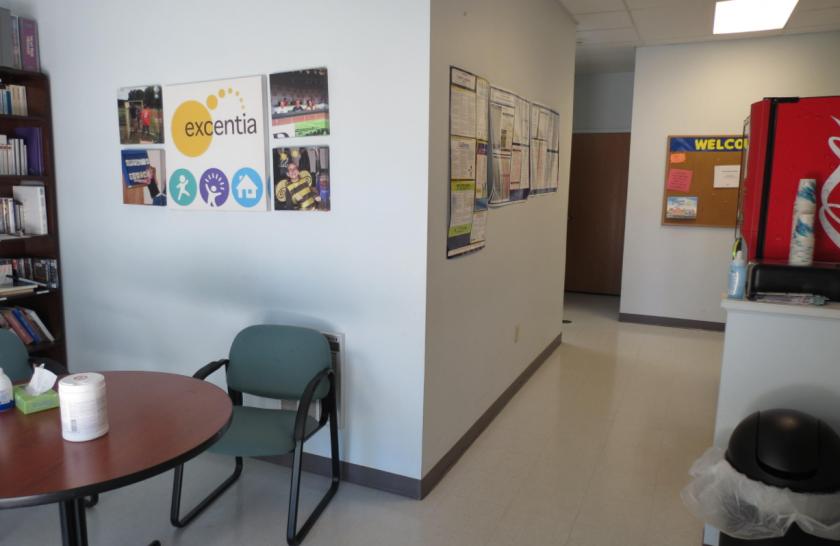
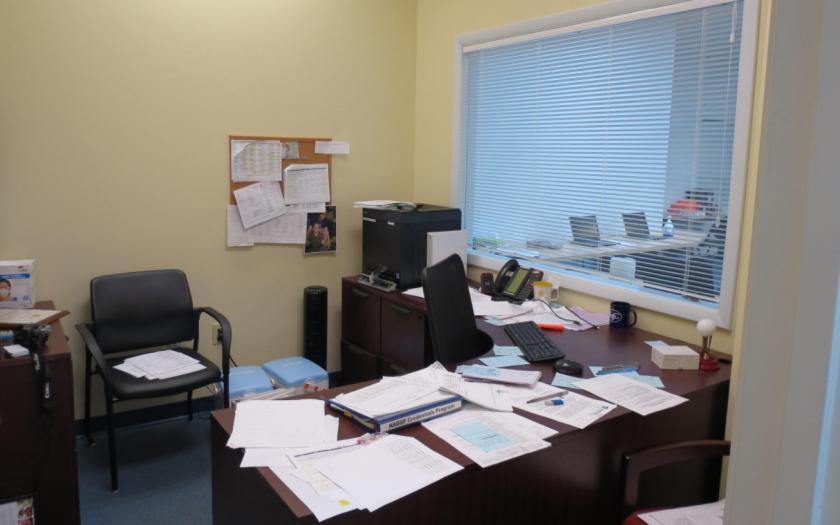
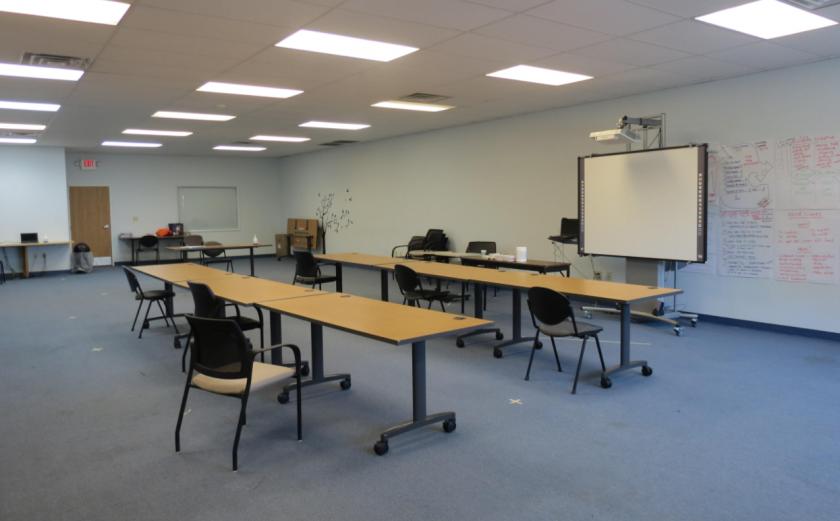
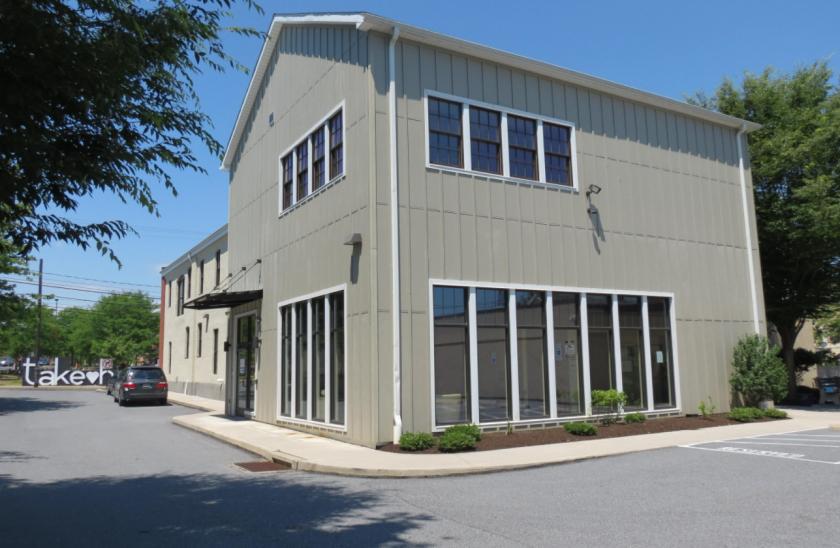
Office Space
617 North Prince Street Lancaster, PA 17603
617 North Prince Street Lancaster, PA 17603

Details & Description
Property Highlights
• Thirty-four 34 on-site parking spaces also available for sublease.
• Contact Dan Berger Jr for details, plans, and showings.
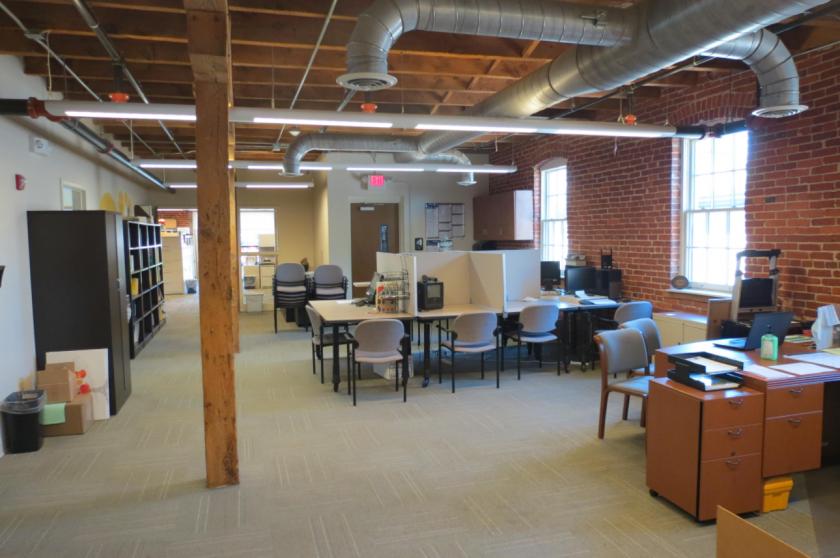
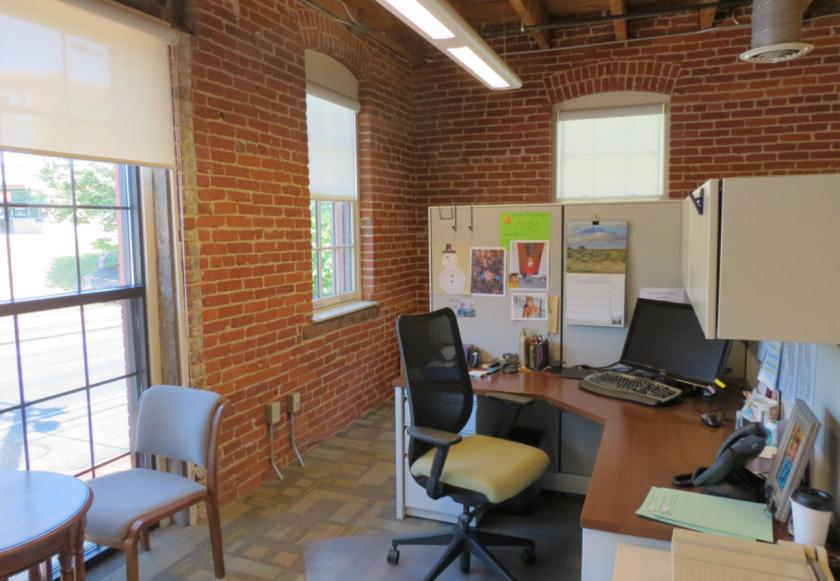
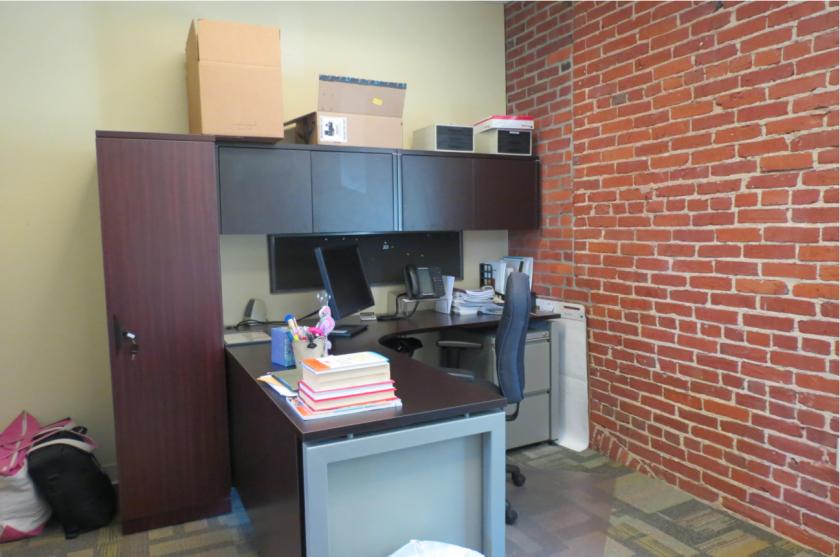
Additional Photos
Listing Agents

Dan Berger Jr.
O: 717-735-6000
danjr@uscommercialrealty.net
O: 717-735-6000
danjr@uscommercialrealty.net
While we strive to provide the most accurate information, all listing information, and demographic data, is provided by third-parties. As such, MyEListing will not be responsible for the accuracy of the information. It is strongly recommended that you verify all information with the listing agent, and any relevant agencies, prior to making any decisions.