Industrial Properties
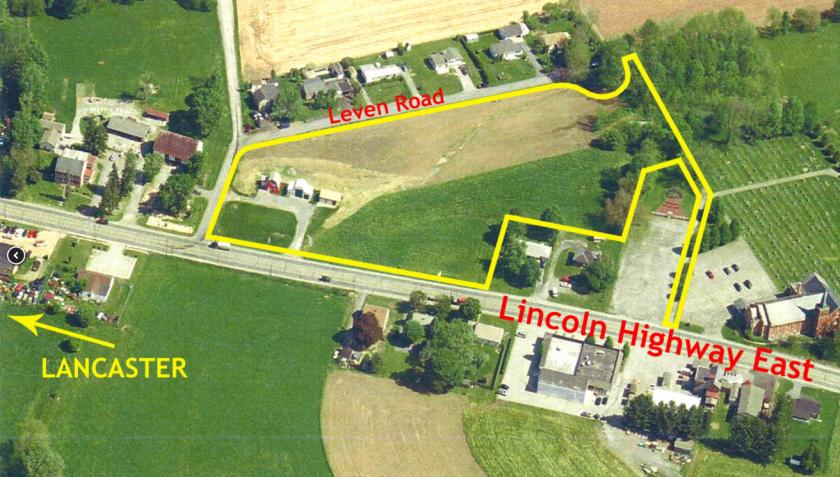
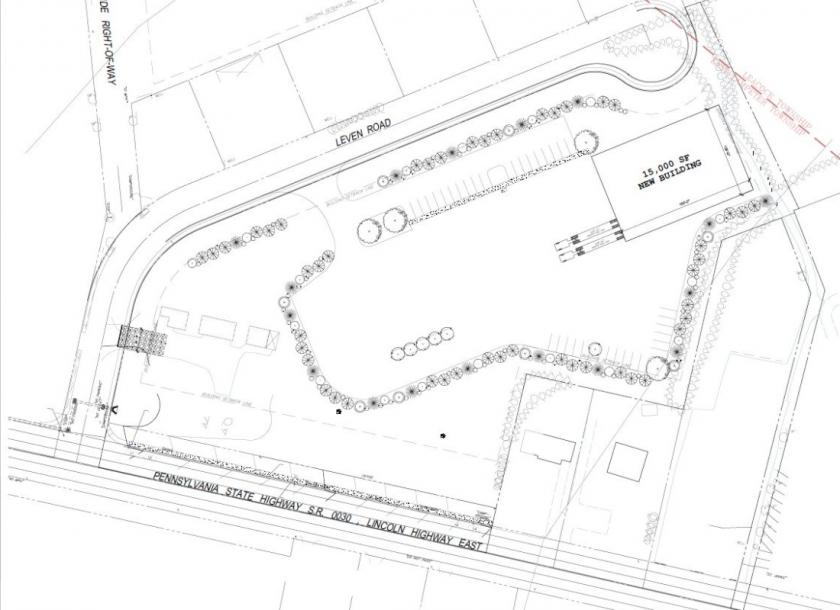
2985 Lincoln Highway East Gordonville, PA 17529
2985 Lincoln Highway East Gordonville, PA 17529
Details & Description
Property Highlights
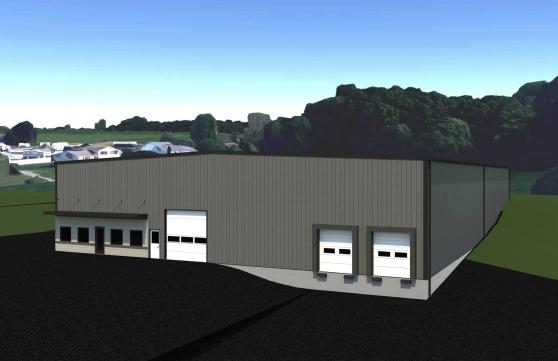
- • Steel building
- • 24 ceiling height
- • Standing seam metal roof
- • One 1 drive-in door 10 x 10
- • Two 2 loading docks with levelers 8 x 9
- • 6 concrete floors
Additional Photos

Listing Agents

Scott Bradbury
O: 717-735-6000
scott@uscommercialrealty.net
O: 717-735-6000
scott@uscommercialrealty.net
While we strive to provide the most accurate information, all listing information, and demographic data, is provided by third-parties. As such, MyEListing will not be responsible for the accuracy of the information. It is strongly recommended that you verify all information with the listing agent, and any relevant agencies, prior to making any decisions.


