Industrial Properties
405 School Road Denver, PA 17517
405 School Road Denver, PA 17517
Details & Description
Property Highlights
- • Gross lease rate Tenant pays pro-rated electric
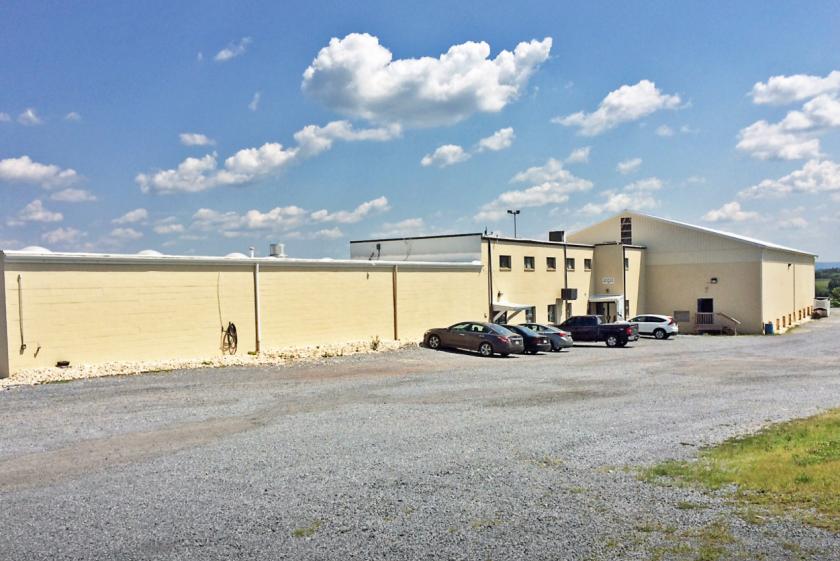
- • Ample parking
- • Outside storage area
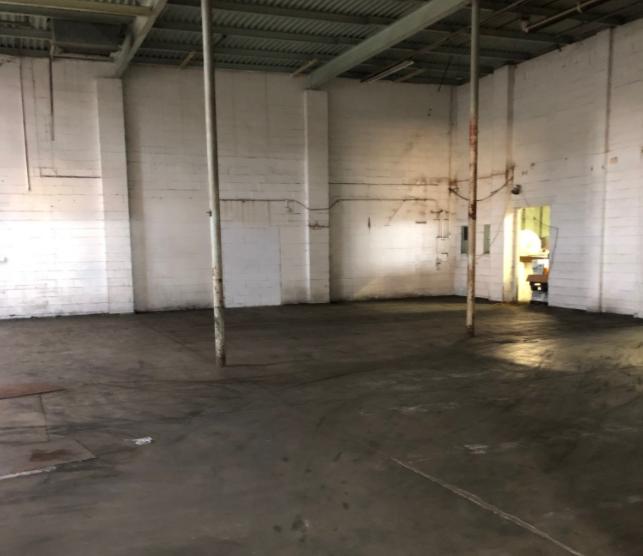
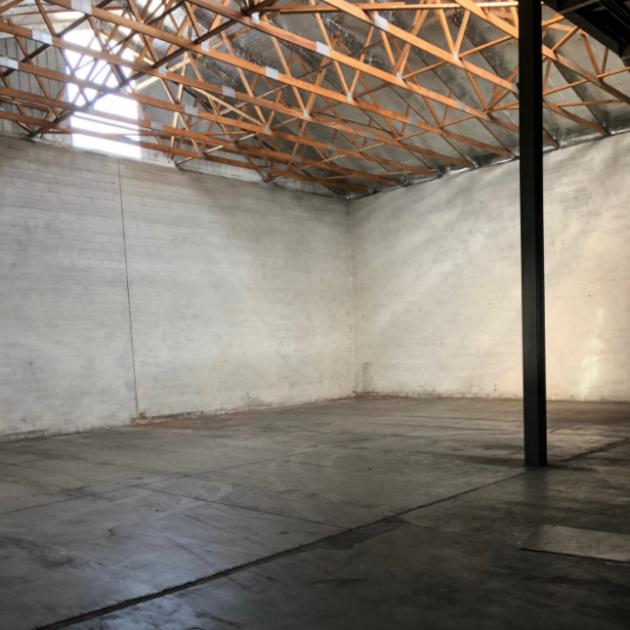
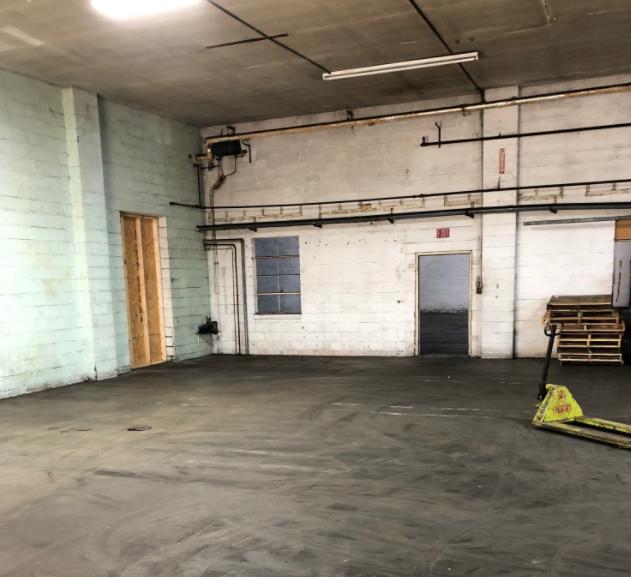
Additional Photos


Listing Agents

Scott Bradbury
O: 717-735-6000
scott@uscommercialrealty.net
O: 717-735-6000
scott@uscommercialrealty.net
While we strive to provide the most accurate information, all listing information, and demographic data, is provided by third-parties. As such, MyEListing will not be responsible for the accuracy of the information. It is strongly recommended that you verify all information with the listing agent, and any relevant agencies, prior to making any decisions.