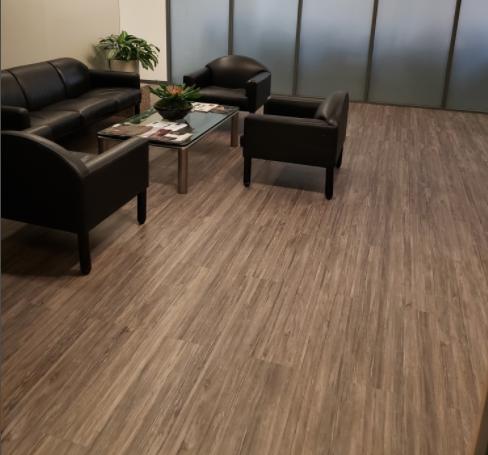
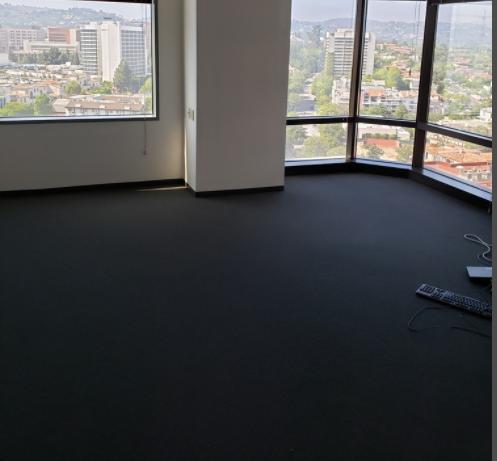
1-Mile | 3-Miles | 5-Miles | ||
---|---|---|---|---|
Total Population | 55,712 | 233,833 | 587,342 | |
Population Median Age | 34 | 38 | 40 | |
Population by Age | 0-9 Yrs | 3165 (5%) | 20299 (8%) | 50651 (8%) |
10-19 Yrs | 9055 (16%) | 27209 (11%) | 54401 (9%) | |
20-29 Yrs | 19623 (35%) | 49496 (21%) | 106376 (18%) | |
30-39 Yrs | 6862 (12%) | 38352 (16%) | 106403 (18%) | |
40-49 Yrs | 4009 (7%) | 26784 (11%) | 79684 (13%) | |
50-59 Yrs | 3982 (7%) | 23937 (10%) | 67879 (11%) | |
60-69 Yrs | 4131 (7%) | 21884 (9%) | 58117 (9%) | |
70+ Yrs | 4884 (8%) | 25872 (11%) | 63829 (10%) | |
Median HH Income | $71,086 | $94,658 | $92,281 | |
Total Household Income | < 24K | 5094 (25%) | 16551 (16%) | 40807 (15%) |
25-49K | 2830 (14%) | 12512 (12%) | 35744 (13%) | |
50-74K | 2499 (12%) | 11710 (11%) | 34420 (12%) | |
75-99K | 1766 (8%) | 11058 (11%) | 31473 (11%) | |
100-199K | 4734 (23%) | 25671 (25%) | 69940 (26%) | |
200K+ | 3191 (15%) | 21436 (21%) | 53074 (19%) | |
Highest Education Level | No Diploma | 1168 | 7703 | 28458 |
Diploma or GED | 2006 | 13098 | 41764 | |
Some College | 3623 | 21322 | 65688 | |
Assoc. Degree | 1450 | 7352 | 21073 | |
Bachelors Degree | 10168 | 59968 | 161961 | |
Higher Degree | 11169 | 51737 | 120248 | |
Total Housing Units | 23,088 | 110,320 | 296,892 | |
--Owner-Occupied | 5,968 | 37,253 | 94,666 | |
--Renter-Occupied | 14,146 | 61,685 | 170,793 | |
Owner-Occupied Values | < 100K | 94 | 626 | 1466 |
100-199K | 26 | 297 | 690 | |
200-299K | 96 | 298 | 993 | |
300-399K | 80 | 465 | 1756 | |
400-499K | 151 | 883 | 3034 | |
500K+ | 5521 | 34684 | 86727 | |
Total Working Age Population | 51,227 | 202,876 | 508,693 | |
In Work Force | 27,425 | 130,111 | 349,981 | |
Not In Work Force | 23,803 | 72,766 | 158,712 | |
Workforce Employed | 25,510 | 122,995 | 332,082 | |
Workforce Unemployed | 1,893 | 6,943 | 17,583 | |
Civlian Workforce | 27,403 | 129,938 | 349,665 | |
Military Workforce | 21 | 172 | 316 | |
Total Households | 20,114 | 98,938 | 265,458 | |
Family Households | 7,288 | 44,925 | 118,133 | |
Non-Family Households | 12,826 | 54,014 | 147,325 | |
Married Couple | 5,425 | 35,659 | 91,478 | |
Other Family | 1,863 | 9,265 | 26,655 | |
Married w/Child | 2,060 | 14,151 | 35,742 | |
Single Male w/Child | 171 | 1,185 | 3,393 | |
Single Female w/Child | 425 | 2,737 | 7,377 |
Population Change Last Two Decades - Plus Projection
2000 | % | 2010 | % | 2020 | % | 2030 | |
---|---|---|---|---|---|---|---|
California | 33,871,648 | +10 | 37,253,956 | +9 | 40,467,295 | +8 | 43,631,295 |
Los Angeles County | 9,519,338 | +3 | 9,818,605 | +6 | 10,369,367 | +4 | 10,759,850 |
Total Working Age Population:
Total Households:
Total Working Age Population:
Total Households:
Total Working Age Population:
Total Households: