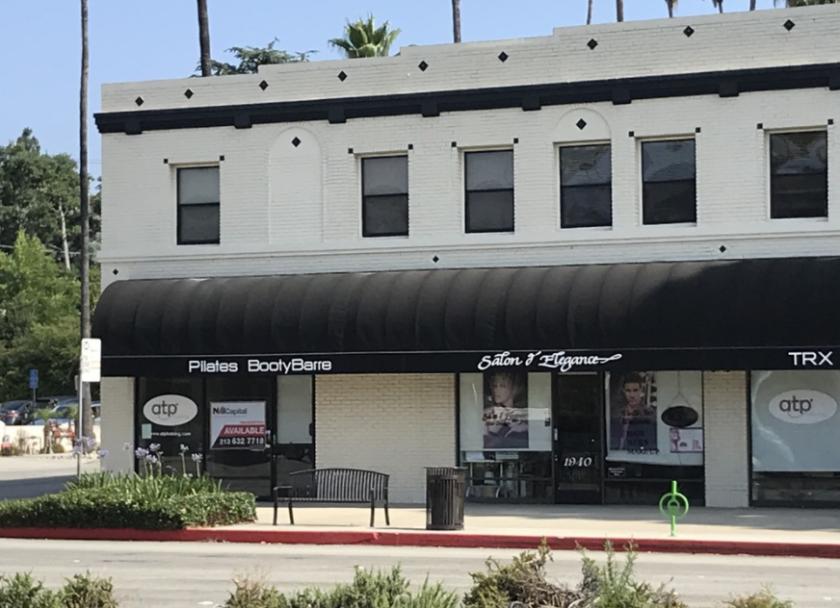
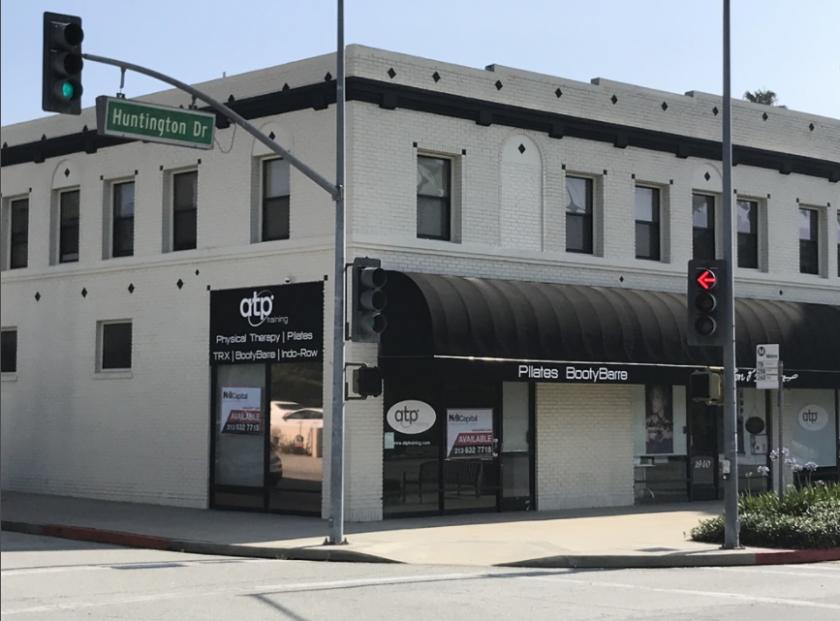
1-Mile | 3-Miles | 5-Miles | ||
---|---|---|---|---|
Total Population | 35,694 | 255,866 | 705,074 | |
Population Median Age | 40 | 40 | 40 | |
Population by Age | 0-9 Yrs | 3957 (11%) | 26525 (10%) | 77557 (10%) |
10-19 Yrs | 3709 (10%) | 25659 (10%) | 77692 (11%) | |
20-29 Yrs | 5179 (14%) | 38809 (15%) | 102973 (14%) | |
30-39 Yrs | 5082 (14%) | 38172 (14%) | 103442 (14%) | |
40-49 Yrs | 5591 (15%) | 35855 (14%) | 98480 (13%) | |
50-59 Yrs | 4727 (13%) | 34232 (13%) | 92266 (13%) | |
60-69 Yrs | 3894 (10%) | 27643 (10%) | 76517 (10%) | |
70+ Yrs | 3555 (9%) | 28972 (11%) | 76147 (10%) | |
Median HH Income | $78,259 | $73,883 | $68,673 | |
Total Household Income | < 24K | 2457 (18%) | 16284 (17%) | 44441 (19%) |
25-49K | 2073 (15%) | 16056 (17%) | 44215 (18%) | |
50-74K | 2028 (15%) | 13970 (15%) | 37095 (15%) | |
75-99K | 1510 (11%) | 11076 (12%) | 28183 (12%) | |
100-199K | 3356 (24%) | 23036 (25%) | 55669 (23%) | |
200K+ | 2086 (15%) | 11044 (12%) | 23985 (10%) | |
Highest Education Level | No Diploma | 2511 | 29722 | 106183 |
Diploma or GED | 3993 | 34492 | 99858 | |
Some College | 4195 | 29183 | 79773 | |
Assoc. Degree | 1973 | 12518 | 33693 | |
Bachelors Degree | 7665 | 48591 | 117390 | |
Higher Degree | 5614 | 33431 | 68818 | |
Total Housing Units | 14,509 | 100,070 | 252,304 | |
--Owner-Occupied | 4,935 | 39,843 | 105,365 | |
--Renter-Occupied | 8,574 | 51,623 | 128,224 | |
Owner-Occupied Values | < 100K | 111 | 647 | 1686 |
100-199K | 94 | 334 | 1150 | |
200-299K | 13 | 832 | 2267 | |
300-399K | 214 | 2707 | 7743 | |
400-499K | 384 | 4930 | 13289 | |
500K+ | 4121 | 30392 | 79230 | |
Total Working Age Population | 29,656 | 214,687 | 581,992 | |
In Work Force | 19,462 | 137,938 | 369,112 | |
Not In Work Force | 10,194 | 76,750 | 212,880 | |
Workforce Employed | 18,826 | 131,143 | 348,265 | |
Workforce Unemployed | 636 | 6,748 | 20,655 | |
Civlian Workforce | 19,462 | 137,891 | 368,921 | |
Military Workforce | 0 | 46 | 191 | |
Total Households | 13,510 | 91,465 | 233,588 | |
Family Households | 8,940 | 59,521 | 160,613 | |
Non-Family Households | 4,570 | 31,945 | 72,975 | |
Married Couple | 6,161 | 41,292 | 109,343 | |
Other Family | 2,779 | 18,228 | 51,271 | |
Married w/Child | 2,598 | 16,755 | 44,704 | |
Single Male w/Child | 325 | 2,010 | 5,534 | |
Single Female w/Child | 814 | 4,140 | 12,557 |
Population Change Last Two Decades - Plus Projection
2000 | % | 2010 | % | 2020 | % | 2030 | |
---|---|---|---|---|---|---|---|
California | 33,871,648 | +10 | 37,253,956 | +9 | 40,467,295 | +8 | 43,631,295 |
Los Angeles County | 9,519,338 | +3 | 9,818,605 | +6 | 10,369,367 | +4 | 10,759,850 |
Total Working Age Population:
Total Households:
Total Working Age Population:
Total Households:
Total Working Age Population:
Total Households: