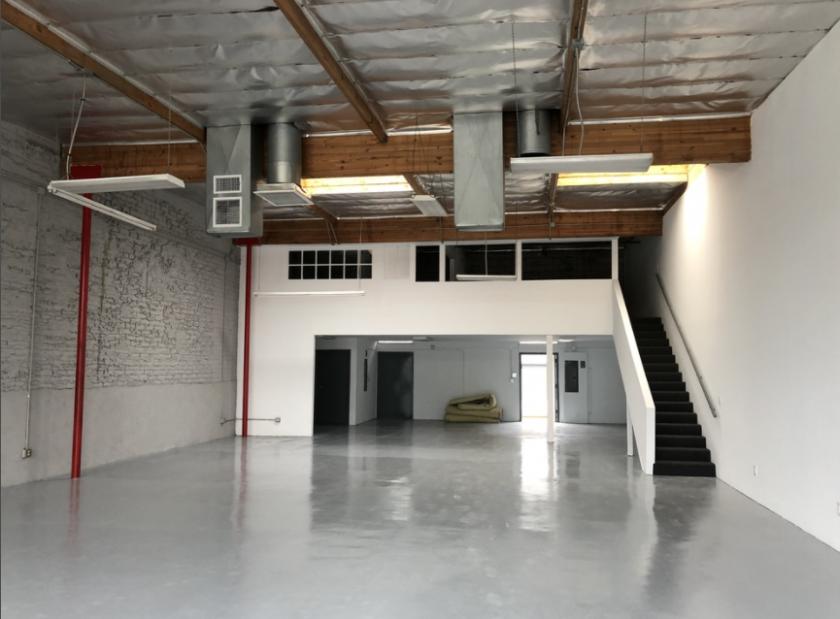
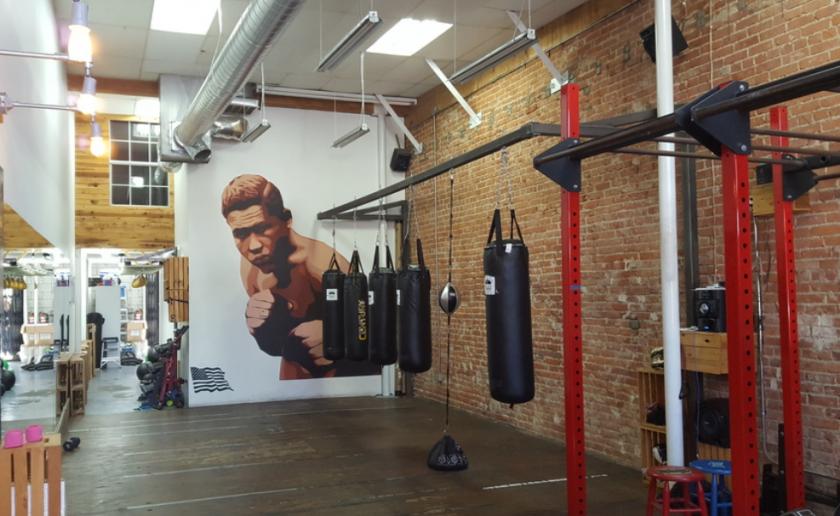
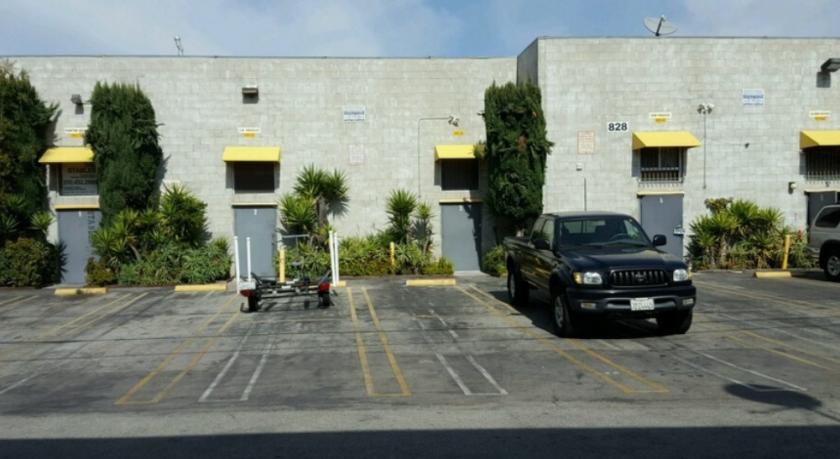
1-Mile | 3-Miles | 5-Miles | ||
---|---|---|---|---|
Total Population | 35,757 | 223,255 | 488,430 | |
Population Median Age | 41 | 41 | 39 | |
Population by Age | 0-9 Yrs | 2372 (6%) | 19091 (8%) | 41903 (8%) |
10-19 Yrs | 2557 (7%) | 15377 (6%) | 45181 (9%) | |
20-29 Yrs | 6365 (17%) | 37658 (16%) | 92145 (18%) | |
30-39 Yrs | 7452 (20%) | 45709 (20%) | 91673 (18%) | |
40-49 Yrs | 4837 (13%) | 30750 (13%) | 63468 (12%) | |
50-59 Yrs | 4793 (13%) | 26832 (12%) | 55555 (11%) | |
60-69 Yrs | 3348 (9%) | 23760 (10%) | 48469 (9%) | |
70+ Yrs | 4033 (11%) | 24077 (10%) | 50035 (10%) | |
Median HH Income | $85,474 | $97,756 | $95,617 | |
Total Household Income | < 24K | 3560 (18%) | 17173 (15%) | 34413 (15%) |
25-49K | 2838 (15%) | 13950 (12%) | 28874 (13%) | |
50-74K | 2022 (10%) | 12268 (11%) | 26666 (12%) | |
75-99K | 2302 (12%) | 12519 (11%) | 25430 (11%) | |
100-199K | 4995 (26%) | 30899 (28%) | 60698 (27%) | |
200K+ | 3052 (16%) | 22765 (20%) | 45774 (20%) | |
Highest Education Level | No Diploma | 1976 | 10063 | 20941 |
Diploma or GED | 2442 | 15222 | 31100 | |
Some College | 4301 | 25347 | 53047 | |
Assoc. Degree | 1544 | 7617 | 16531 | |
Bachelors Degree | 11141 | 70888 | 137287 | |
Higher Degree | 7309 | 47670 | 103422 | |
Total Housing Units | 20,992 | 121,842 | 245,921 | |
--Owner-Occupied | 3,922 | 33,769 | 76,015 | |
--Renter-Occupied | 14,847 | 75,805 | 145,841 | |
Owner-Occupied Values | < 100K | 94 | 629 | 1209 |
100-199K | 20 | 294 | 596 | |
200-299K | 58 | 308 | 857 | |
300-399K | 52 | 418 | 965 | |
400-499K | 159 | 811 | 2099 | |
500K+ | 3540 | 31309 | 70289 | |
Total Working Age Population | 32,132 | 194,800 | 425,514 | |
In Work Force | 22,392 | 140,266 | 292,632 | |
Not In Work Force | 9,739 | 54,534 | 132,882 | |
Workforce Employed | 21,007 | 133,305 | 277,982 | |
Workforce Unemployed | 1,367 | 6,802 | 14,420 | |
Civlian Workforce | 22,374 | 140,107 | 292,402 | |
Military Workforce | 18 | 159 | 230 | |
Total Households | 18,769 | 109,574 | 221,856 | |
Family Households | 6,449 | 45,139 | 96,502 | |
Non-Family Households | 12,319 | 64,435 | 125,354 | |
Married Couple | 4,835 | 34,993 | 75,125 | |
Other Family | 1,614 | 10,147 | 21,377 | |
Married w/Child | 1,747 | 13,082 | 28,395 | |
Single Male w/Child | 317 | 1,533 | 2,864 | |
Single Female w/Child | 467 | 3,018 | 6,154 |
Population Change Last Two Decades - Plus Projection
2000 | % | 2010 | % | 2020 | % | 2030 | |
---|---|---|---|---|---|---|---|
California | 33,871,648 | +10 | 37,253,956 | +9 | 40,467,295 | +8 | 43,631,295 |
Los Angeles County | 9,519,338 | +3 | 9,818,605 | +6 | 10,369,367 | +4 | 10,759,850 |
Total Working Age Population:
Total Households:
Total Working Age Population:
Total Households:
Total Working Age Population:
Total Households: