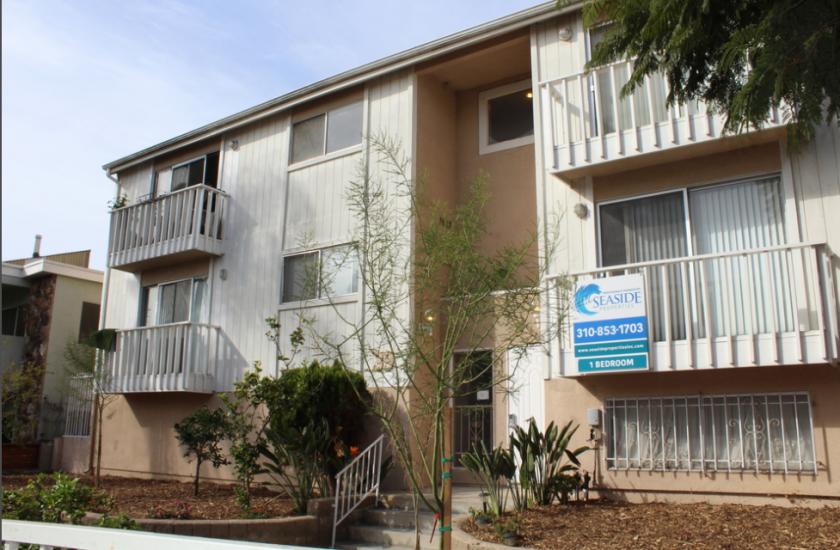
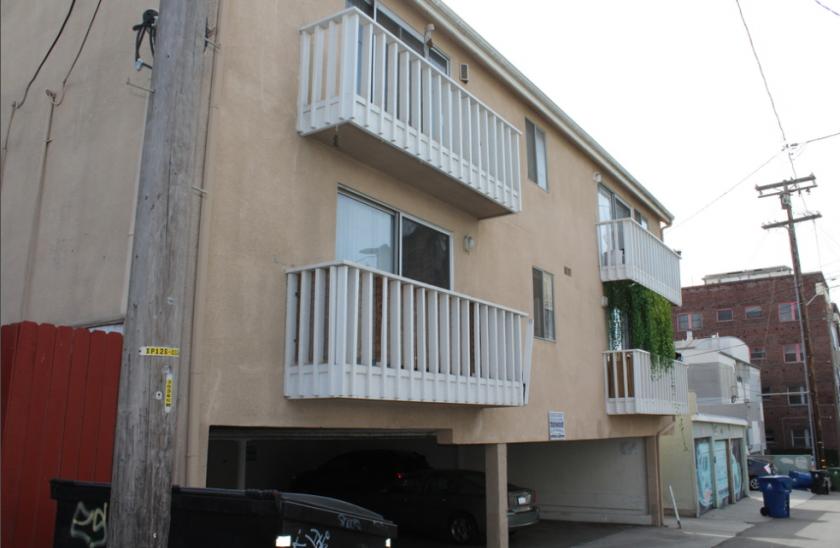
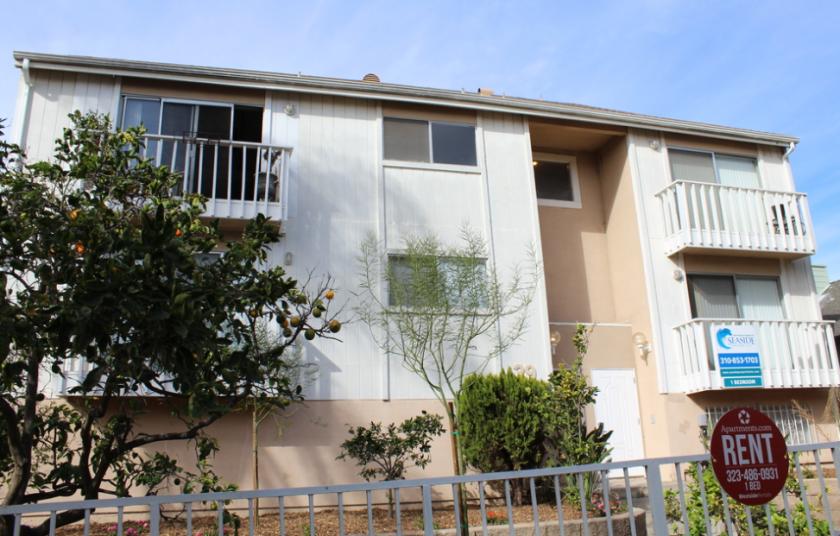
1-Mile | 3-Miles | 5-Miles | ||
---|---|---|---|---|
Total Population | 29,148 | 185,007 | 441,897 | |
Population Median Age | 42 | 41 | 40 | |
Population by Age | 0-9 Yrs | 2010 (6%) | 15459 (8%) | 39401 (8%) |
10-19 Yrs | 1506 (5%) | 11966 (6%) | 33586 (7%) | |
20-29 Yrs | 4165 (14%) | 28459 (15%) | 78299 (17%) | |
30-39 Yrs | 7368 (25%) | 38538 (20%) | 88445 (20%) | |
40-49 Yrs | 3923 (13%) | 25570 (13%) | 60033 (13%) | |
50-59 Yrs | 3917 (13%) | 24432 (13%) | 52167 (11%) | |
60-69 Yrs | 3131 (10%) | 20703 (11%) | 45206 (10%) | |
70+ Yrs | 3127 (10%) | 19880 (10%) | 44761 (10%) | |
Median HH Income | $90,504 | $99,122 | $96,043 | |
Total Household Income | < 24K | 3056 (18%) | 14699 (15%) | 30690 (14%) |
25-49K | 2257 (13%) | 11779 (12%) | 26915 (13%) | |
50-74K | 1680 (10%) | 10235 (11%) | 25250 (12%) | |
75-99K | 1966 (11%) | 10127 (10%) | 24075 (11%) | |
100-199K | 4173 (25%) | 27156 (29%) | 57676 (27%) | |
200K+ | 3293 (20%) | 18974 (20%) | 41637 (20%) | |
Highest Education Level | No Diploma | 1345 | 8488 | 20171 |
Diploma or GED | 2148 | 13519 | 30063 | |
Some College | 3565 | 22537 | 51251 | |
Assoc. Degree | 859 | 6469 | 15717 | |
Bachelors Degree | 10505 | 59190 | 130390 | |
Higher Degree | 6275 | 38318 | 93127 | |
Total Housing Units | 18,807 | 104,974 | 227,086 | |
--Owner-Occupied | 4,250 | 27,152 | 69,641 | |
--Renter-Occupied | 12,174 | 65,819 | 136,603 | |
Owner-Occupied Values | < 100K | 98 | 493 | 1133 |
100-199K | 32 | 203 | 528 | |
200-299K | 71 | 347 | 763 | |
300-399K | 91 | 289 | 946 | |
400-499K | 76 | 668 | 2106 | |
500K+ | 3882 | 25153 | 64165 | |
Total Working Age Population | 26,200 | 162,442 | 383,035 | |
In Work Force | 19,642 | 117,169 | 272,405 | |
Not In Work Force | 6,558 | 45,273 | 110,630 | |
Workforce Employed | 18,556 | 111,529 | 259,203 | |
Workforce Unemployed | 1,059 | 5,594 | 12,989 | |
Civlian Workforce | 19,615 | 117,122 | 272,192 | |
Military Workforce | 27 | 47 | 213 | |
Total Households | 16,424 | 92,971 | 206,243 | |
Family Households | 5,319 | 37,565 | 91,101 | |
Non-Family Households | 11,106 | 55,406 | 115,142 | |
Married Couple | 3,980 | 29,001 | 70,567 | |
Other Family | 1,338 | 8,564 | 20,534 | |
Married w/Child | 1,212 | 10,177 | 26,507 | |
Single Male w/Child | 239 | 1,344 | 2,748 | |
Single Female w/Child | 333 | 2,666 | 5,941 |
Population Change Last Two Decades - Plus Projection
2000 | % | 2010 | % | 2020 | % | 2030 | |
---|---|---|---|---|---|---|---|
California | 33,871,648 | +10 | 37,253,956 | +9 | 40,467,295 | +8 | 43,631,295 |
Los Angeles County | 9,519,338 | +3 | 9,818,605 | +6 | 10,369,367 | +4 | 10,759,850 |
Total Working Age Population:
Total Households:
Total Working Age Population:
Total Households:
Total Working Age Population:
Total Households: