Industrial Properties
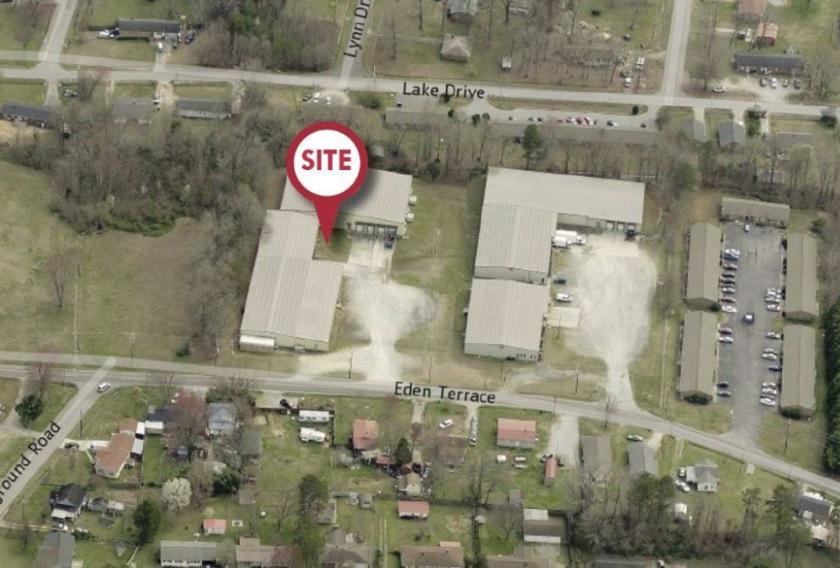
701 Eden Terrace Archdale, NC 27263
701 Eden Terrace Archdale, NC 27263
Details & Description
Property Highlights
- • Situated on 2.5 acres
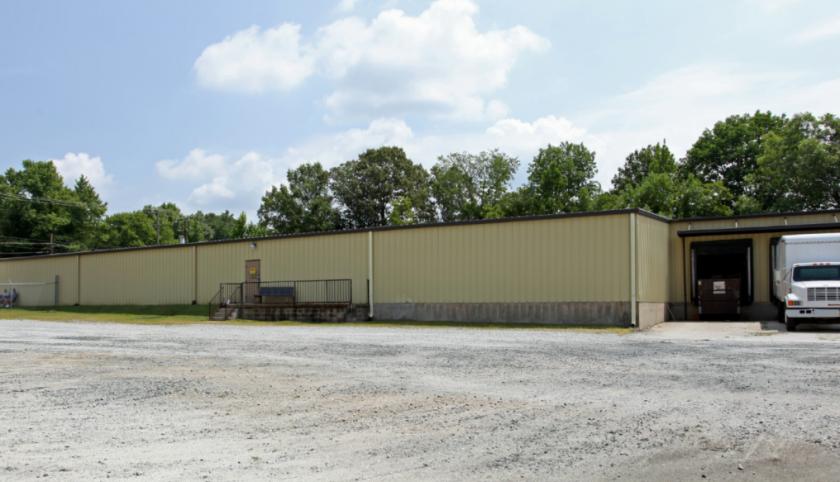
- • Six 6 dock high doors
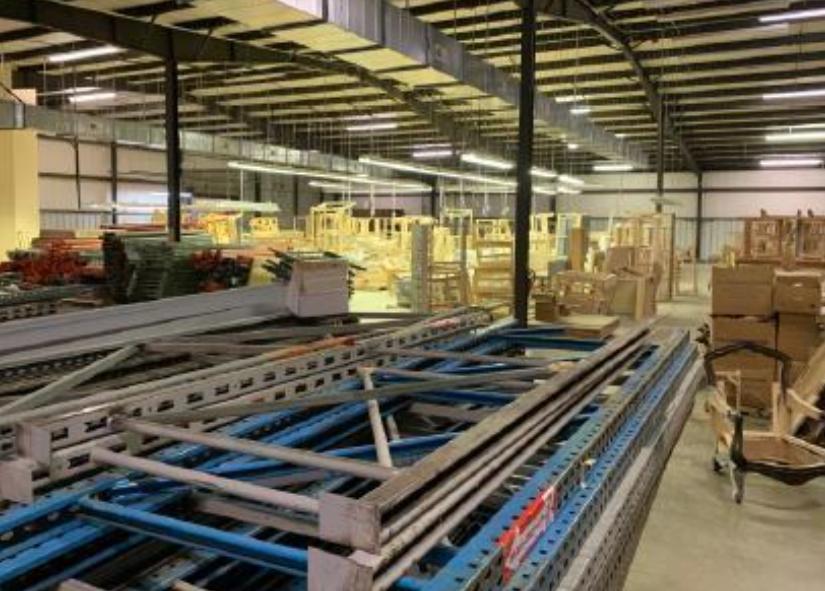
- • Partially air conditioned
- • Clear height 13 - 21
- • 1,200 AMP power
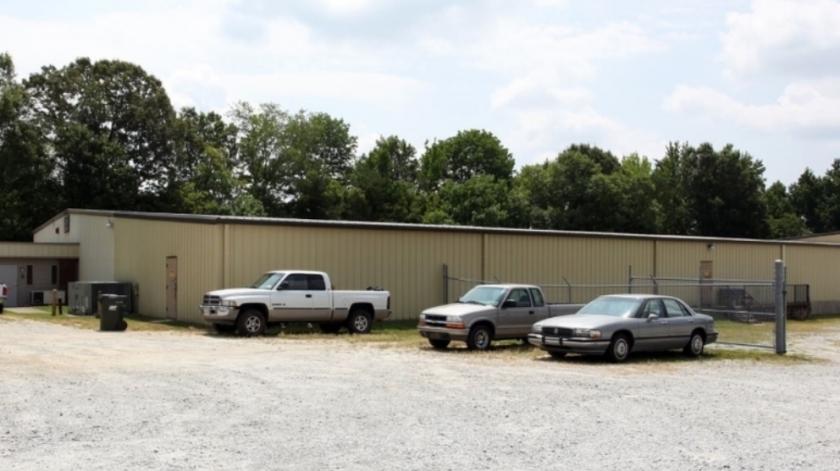
- • Fenced lot with gate
Additional Photos
Listing Agents

John Purdie
O: 336-358-3226
M: 336-207-2175
jpurdie@naipt.com
O: 336-358-3226
M: 336-207-2175
jpurdie@naipt.com
While we strive to provide the most accurate information, all listing information, and demographic data, is provided by third-parties. As such, MyEListing will not be responsible for the accuracy of the information. It is strongly recommended that you verify all information with the listing agent, and any relevant agencies, prior to making any decisions.


