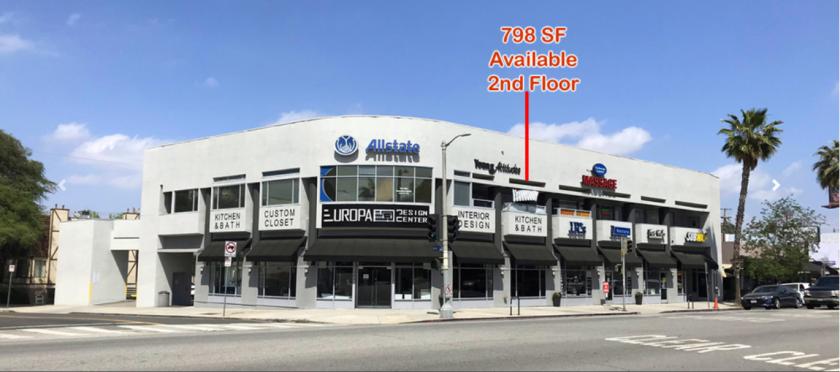
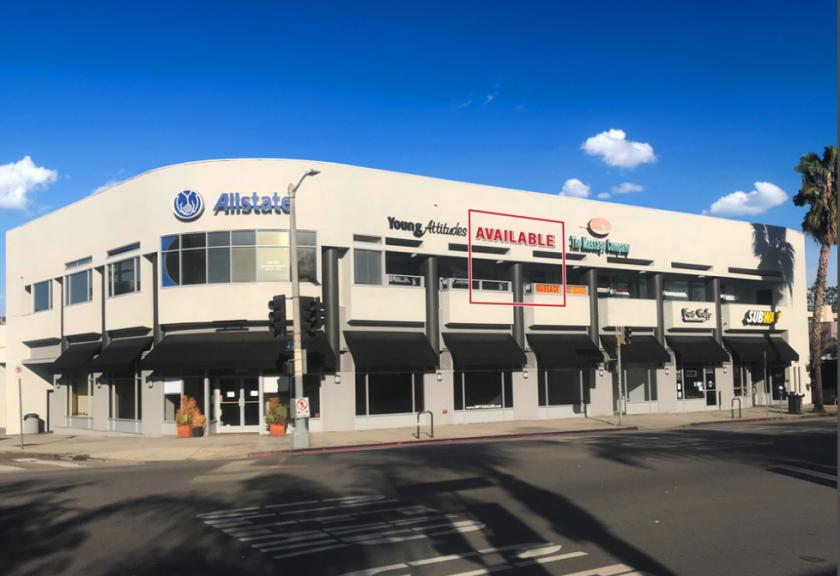
Retail Space
15053 Ventura Boulevard Los Angeles, CA 91403
15053 Ventura Boulevard Los Angeles, CA 91403
Details & Description
Property Highlights
- • Parking 41,000 Ratio - Surface Subterranean
- • Prime Sherman Oaks Location
- • Signalized Corner
- • Excellent Signage - Up to 90 Feet of Frontage
- • Strong Demographics
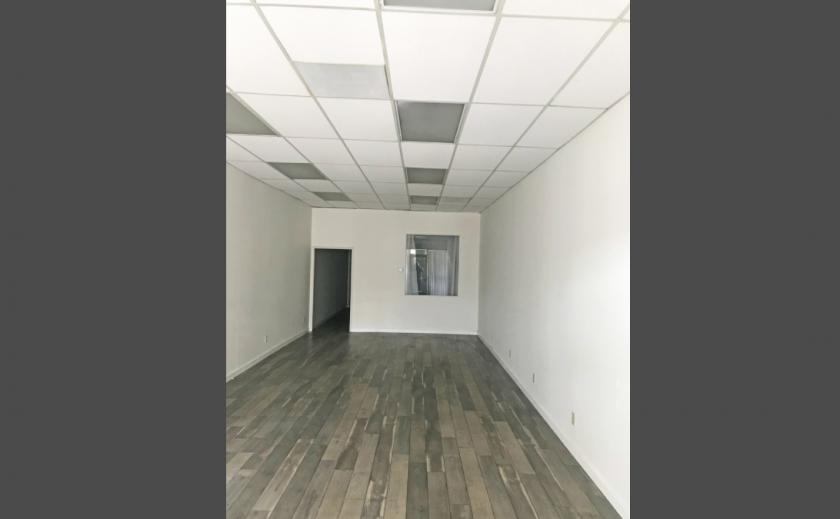
Additional Photos

Listing Agents

Adam Comora
O: 818-742-1610
M: 818-521-2623
acomora@naicapital.com
O: 818-742-1610
M: 818-521-2623
acomora@naicapital.com

Todd Rizzardi
O: 818-815-2422
trizzardi@naicapital.com
O: 818-815-2422
trizzardi@naicapital.com
While we strive to provide the most accurate information, all listing information, and demographic data, is provided by third-parties. As such, MyEListing will not be responsible for the accuracy of the information. It is strongly recommended that you verify all information with the listing agent, and any relevant agencies, prior to making any decisions.


