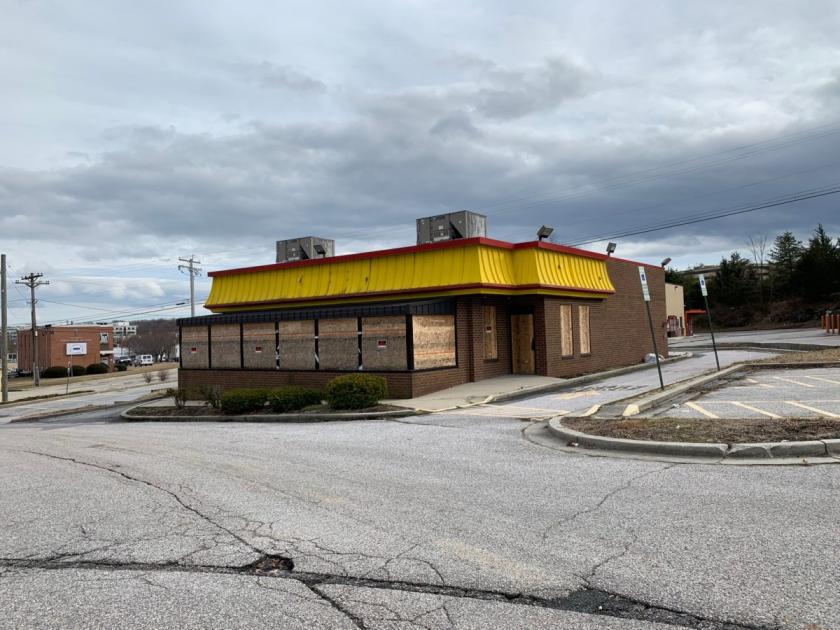
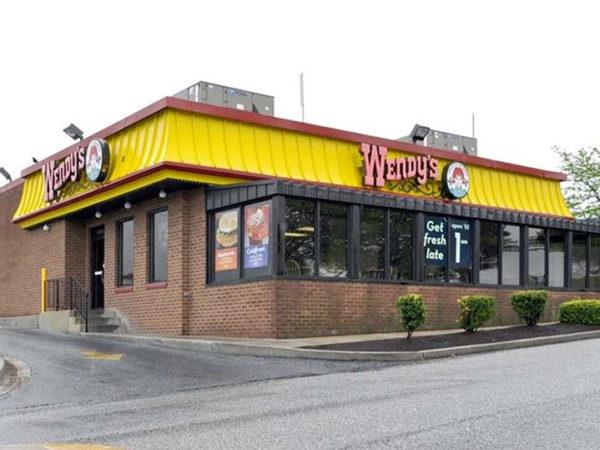
1-Mile | 3-Miles | 5-Miles | ||
---|---|---|---|---|
Total Population | 10,117 | 122,669 | 353,353 | |
Population Median Age | 38 | 39 | 40 | |
Population by Age | 0-9 Yrs | 1233 (12%) | 13981 (11%) | 41314 (11%) |
10-19 Yrs | 1183 (11%) | 14321 (11%) | 42258 (11%) | |
20-29 Yrs | 1497 (14%) | 17784 (14%) | 50442 (14%) | |
30-39 Yrs | 1560 (15%) | 17290 (14%) | 47353 (13%) | |
40-49 Yrs | 1240 (12%) | 15741 (12%) | 40985 (11%) | |
50-59 Yrs | 1252 (12%) | 16255 (13%) | 48081 (13%) | |
60-69 Yrs | 1222 (12%) | 14725 (12%) | 42110 (11%) | |
70+ Yrs | 930 (9%) | 12571 (10%) | 40809 (11%) | |
Median HH Income | $61,790 | $66,458 | $58,360 | |
Total Household Income | < 24K | 579 (17%) | 7389 (15%) | 28571 (21%) |
25-49K | 759 (22%) | 9270 (19%) | 28274 (21%) | |
50-74K | 741 (21%) | 10122 (21%) | 24780 (18%) | |
75-99K | 409 (12%) | 6228 (13%) | 15287 (11%) | |
100-199K | 697 (20%) | 11540 (24%) | 28028 (21%) | |
200K+ | 190 (5%) | 2345 (5%) | 7558 (5%) | |
Highest Education Level | No Diploma | 1035 | 8168 | 28625 |
Diploma or GED | 2212 | 23531 | 71809 | |
Some College | 1411 | 19591 | 53968 | |
Assoc. Degree | 542 | 6281 | 16330 | |
Bachelors Degree | 1146 | 17386 | 44226 | |
Higher Degree | 794 | 12014 | 32097 | |
Total Housing Units | 3,687 | 51,182 | 154,201 | |
--Owner-Occupied | 1,991 | 28,625 | 75,411 | |
--Renter-Occupied | 1,384 | 18,269 | 57,088 | |
Owner-Occupied Values | < 100K | 99 | 1662 | 12755 |
100-199K | 720 | 10411 | 24162 | |
200-299K | 928 | 10669 | 20638 | |
300-399K | 104 | 3742 | 8366 | |
400-499K | 71 | 1167 | 4395 | |
500K+ | 70 | 975 | 5095 | |
Total Working Age Population | 8,162 | 100,331 | 286,816 | |
In Work Force | 5,475 | 67,190 | 178,268 | |
Not In Work Force | 2,687 | 33,140 | 108,548 | |
Workforce Employed | 5,229 | 63,595 | 164,905 | |
Workforce Unemployed | 246 | 3,554 | 13,138 | |
Civlian Workforce | 5,475 | 67,148 | 178,043 | |
Military Workforce | 0 | 42 | 225 | |
Total Households | 3,375 | 46,894 | 132,499 | |
Family Households | 2,202 | 28,853 | 79,352 | |
Non-Family Households | 1,173 | 18,041 | 53,147 | |
Married Couple | 1,433 | 16,871 | 44,590 | |
Other Family | 769 | 11,983 | 34,762 | |
Married w/Child | 583 | 6,589 | 17,011 | |
Single Male w/Child | 66 | 606 | 2,288 | |
Single Female w/Child | 162 | 4,035 | 12,160 |
Population Change Last Two Decades - Plus Projection
2000 | % | 2010 | % | 2020 | % | 2030 | |
---|---|---|---|---|---|---|---|
Maryland | 5,296,486 | +9 | 5,773,552 | +6 | 6,141,900 | +6 | 6,518,750 |
Baltimore County | 754,292 | +7 | 805,029 | +5 | 847,000 | +2 | 862,200 |
Carroll County | 150,897 | +11 | 167,134 | +1 | 169,200 | +4 | 175,150 |
Howard County | 247,842 | +16 | 287,085 | +17 | 336,900 | +9 | 366,800 |
Baltimore city | 651,154 | -5 | 620,961 | -1 | 616,300 | +1 | 625,100 |
Total Working Age Population:
Total Households:
Total Working Age Population:
Total Households:
Total Working Age Population:
Total Households: