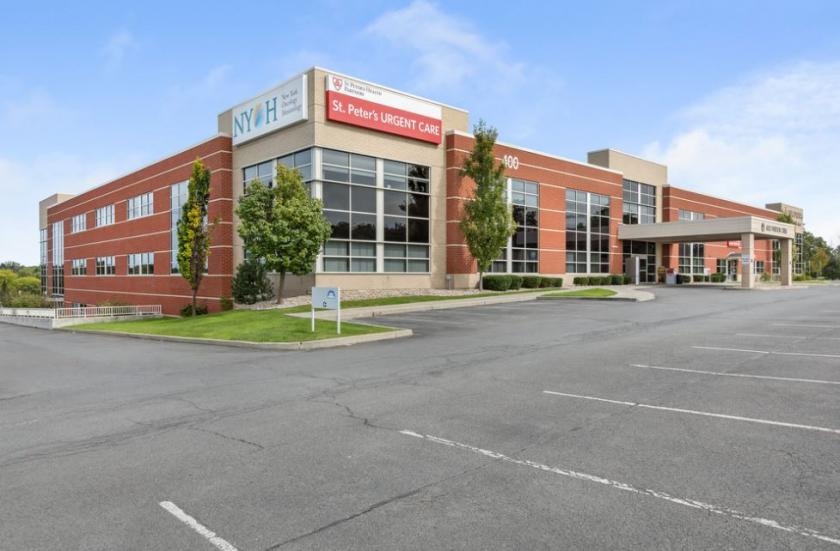
Office Space
400 Patroon Creek Boulevard Albany, NY 12206
400 Patroon Creek Boulevard Albany, NY 12206
Details & Description
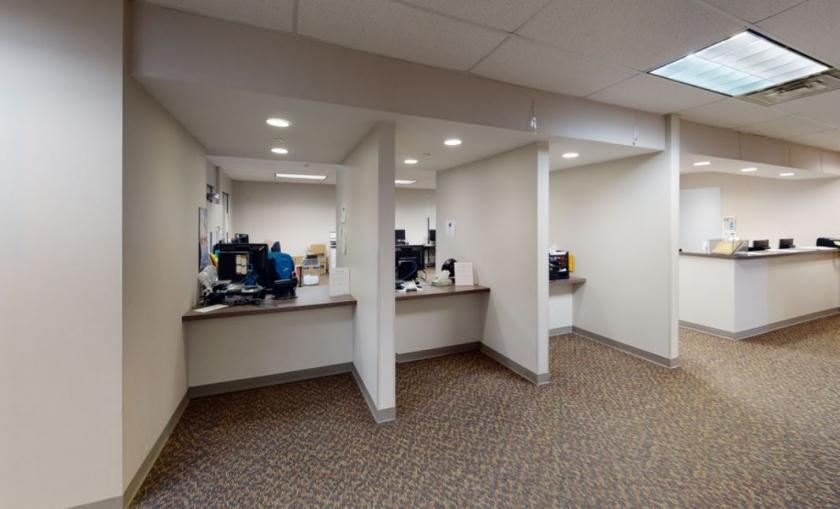
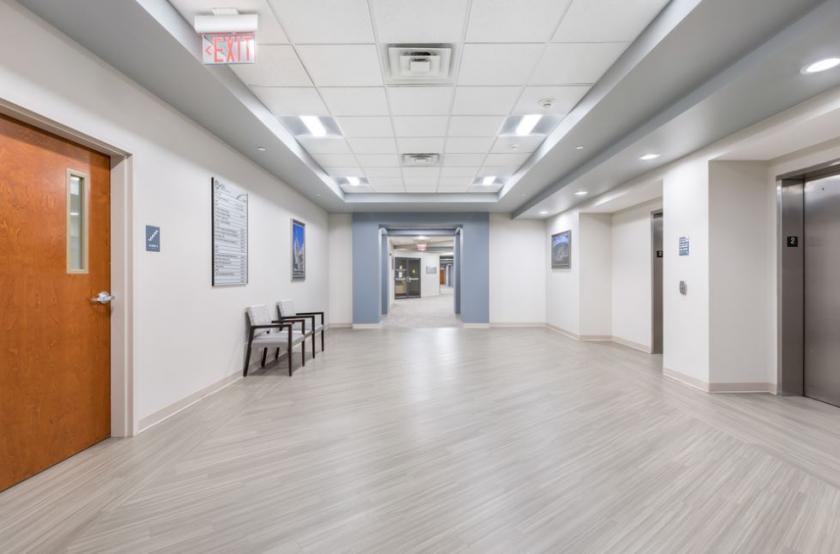
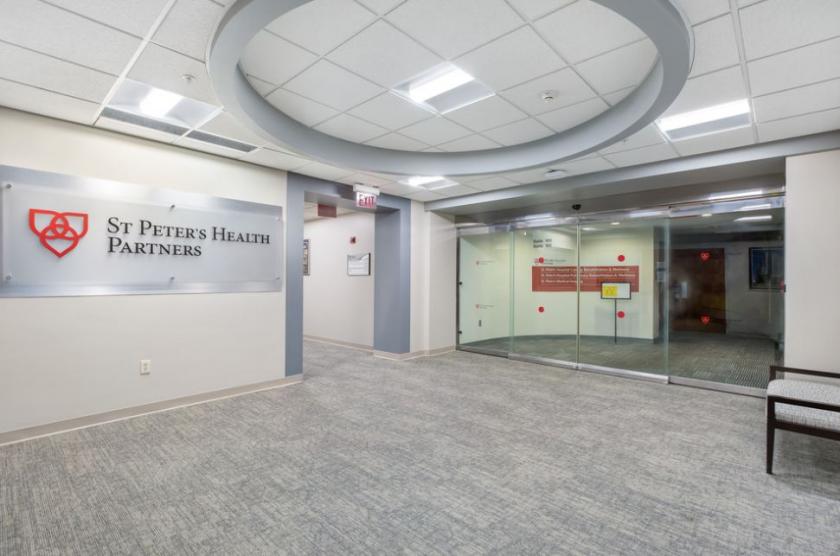
Additional Photos

Listing Agents

James Verro
O: 518-465-1400
M: 518-369-5048
jverro@ccim.net
O: 518-465-1400
M: 518-369-5048
jverro@ccim.net

William McLaughlin
O: 518-465-1400
M: 518-428-1164
felton@naiplatform.com
O: 518-465-1400
M: 518-428-1164
felton@naiplatform.com
While we strive to provide the most accurate information, all listing information, and demographic data, is provided by third-parties. As such, MyEListing will not be responsible for the accuracy of the information. It is strongly recommended that you verify all information with the listing agent, and any relevant agencies, prior to making any decisions.


