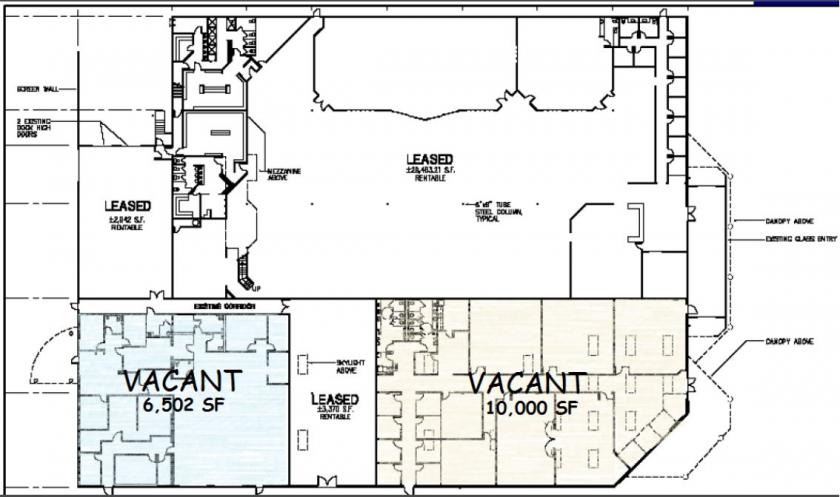
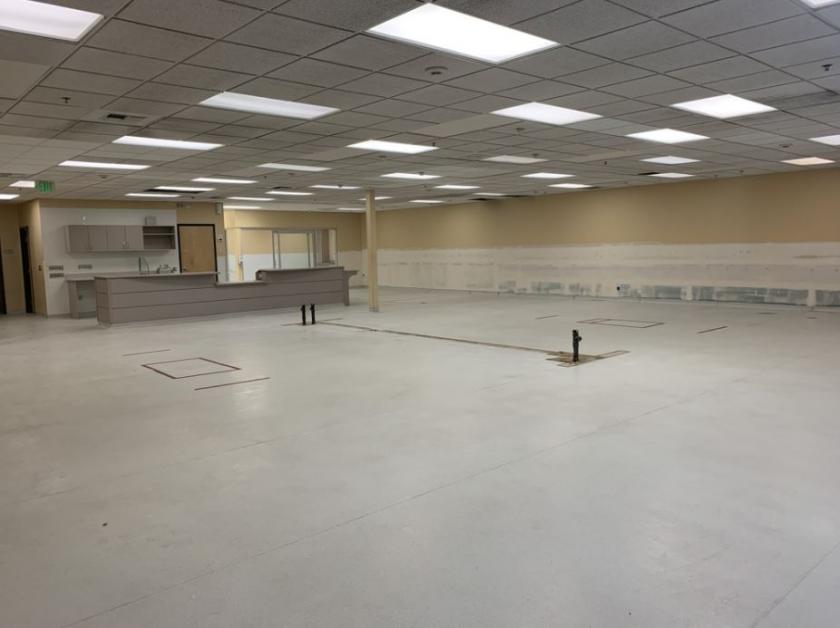
Suite B: 10,000 SF (admin office & classrooms)
Suite C: 6,502 SF (dialysis clinic infrastructure in place)
20'+ ceiling height
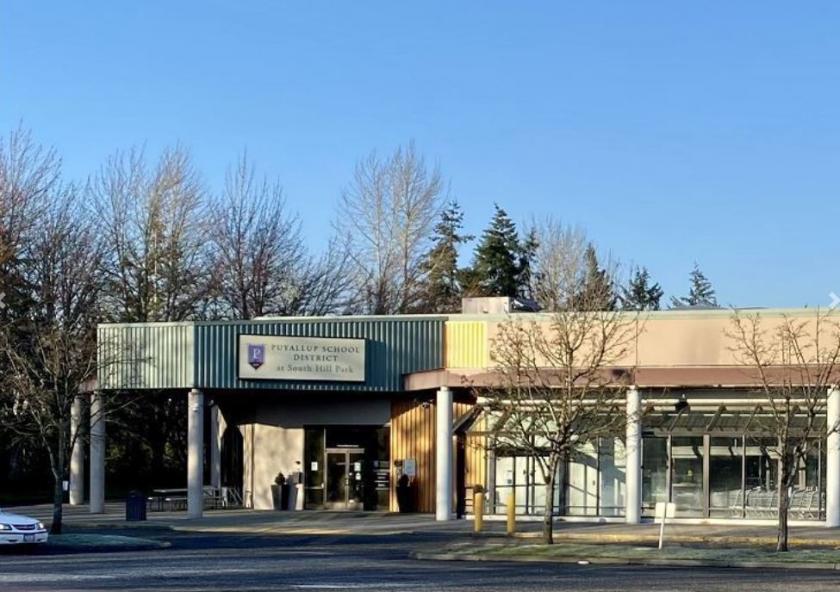
Lighted pylon signage with SR-512 frontage
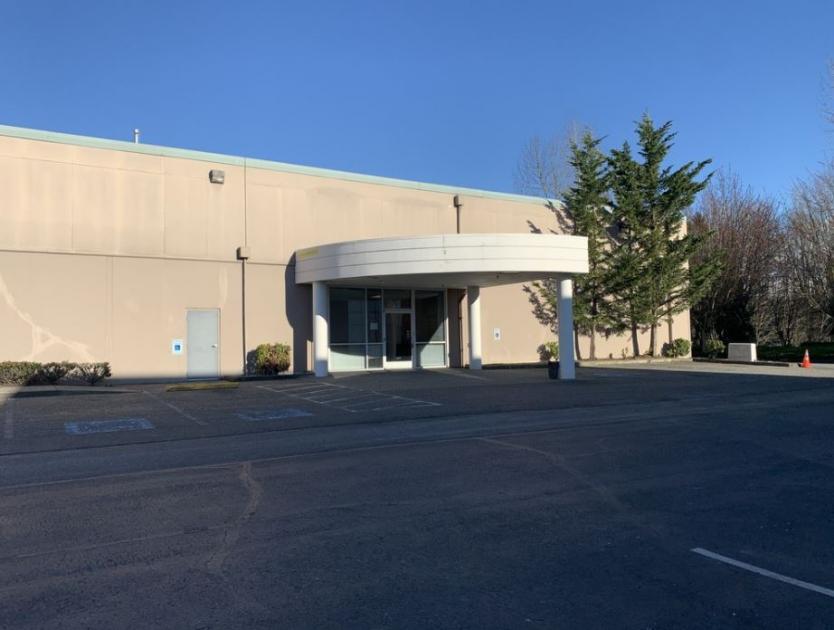
Easy access to SR-512 and near South Hill Mall
Large, commercial business center with ample parking (3:1,000)
General Commercial Zoning
Lease Rates: Suite B - $15.00 gross, Suite C - $8.00 triple net
No part of this information may be copied, reproduced, repurposed, or screen-captured for any commercial purpose without prior written authorization from MyEListing.
While we strive to provide the most accurate information, all listing information, and demographic data, is provided by third-parties. As such, MyEListing will not be responsible for the accuracy of the information. It is strongly recommended that you verify all information with the listing agent, and any relevant agencies, prior to making any decisions.
What is the asking price for 716 South Hill Park Drive in Puyallup?
The asking price for 716 South Hill Park Drive is $8.00 - $15.00 a SF per Year
What is the building size of this commercial Retail property?
The size of this multi-unit property varies between 6502 - 10000 square feet
What kind of Retail is the propery at 716 South Hill Park Drive?
The property at 716 South Hill Park Drive Puyallup, WA 98373 is listed as a Shopping Center Retail property
What is the population within 1 mile of 716 South Hill Park Drive in Puyallup?
The population within 1 mile of 716 South Hill Park Drive Puyallup, WA 98373 is 8,144 people.
Who do I contact for questions about 716 South Hill Park Drive?
You should contact the listing agent,
Kim Marvik, for any details regarding this commercial listing.