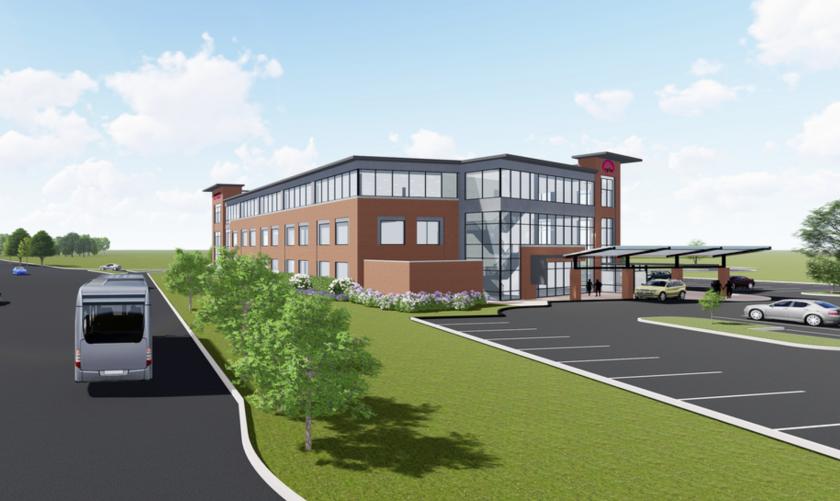
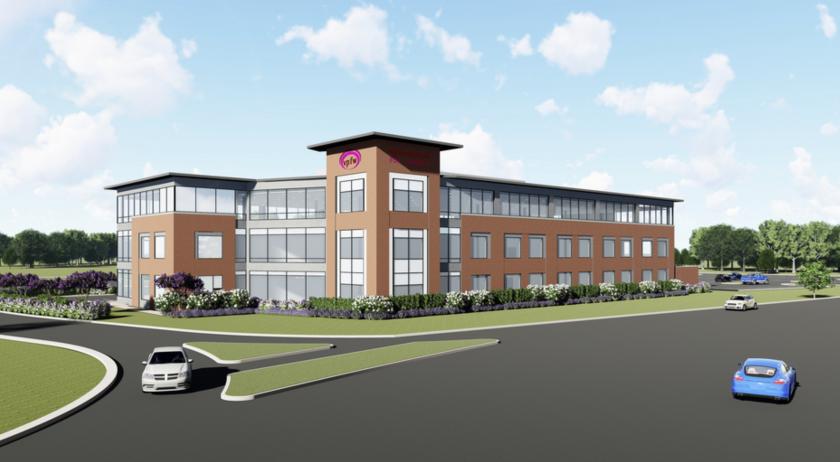
1-Mile | 3-Miles | 5-Miles | ||
---|---|---|---|---|
Total Population | 7,769 | 53,395 | 171,545 | |
Population Median Age | 39 | 37 | 36 | |
Population by Age | 0-9 Yrs | 889 (11%) | 5877 (11%) | 20251 (11%) |
10-19 Yrs | 1048 (13%) | 6183 (11%) | 22029 (12%) | |
20-29 Yrs | 830 (10%) | 9883 (18%) | 34563 (20%) | |
30-39 Yrs | 1068 (13%) | 8822 (16%) | 25177 (14%) | |
40-49 Yrs | 1278 (16%) | 6408 (12%) | 19210 (11%) | |
50-59 Yrs | 1169 (15%) | 7156 (13%) | 20747 (12%) | |
60-69 Yrs | 862 (11%) | 5337 (9%) | 17035 (9%) | |
70+ Yrs | 625 (8%) | 3727 (6%) | 12533 (7%) | |
Median HH Income | $43,268 | $46,476 | $41,579 | |
Total Household Income | < 24K | 1008 (32%) | 6312 (28%) | 21115 (32%) |
25-49K | 765 (24%) | 5438 (24%) | 16839 (25%) | |
50-74K | 337 (10%) | 4083 (18%) | 11684 (17%) | |
75-99K | 455 (14%) | 2578 (11%) | 6569 (10%) | |
100-199K | 457 (14%) | 2945 (13%) | 7691 (11%) | |
200K+ | 107 (3%) | 627 (2%) | 1749 (2%) | |
Highest Education Level | No Diploma | 873 | 5843 | 20129 |
Diploma or GED | 1588 | 10174 | 32730 | |
Some College | 1386 | 7974 | 23278 | |
Assoc. Degree | 386 | 2562 | 7486 | |
Bachelors Degree | 695 | 6590 | 18069 | |
Higher Degree | 486 | 4003 | 10812 | |
Total Housing Units | 3,373 | 24,587 | 73,228 | |
--Owner-Occupied | 1,867 | 9,061 | 26,681 | |
--Renter-Occupied | 1,261 | 12,922 | 38,966 | |
Owner-Occupied Values | < 100K | 255 | 1930 | 5295 |
100-199K | 958 | 4045 | 13308 | |
200-299K | 484 | 1789 | 4499 | |
300-399K | 107 | 620 | 1768 | |
400-499K | 17 | 247 | 729 | |
500K+ | 45 | 430 | 1082 | |
Total Working Age Population | 6,379 | 43,779 | 140,382 | |
In Work Force | 4,012 | 29,736 | 91,237 | |
Not In Work Force | 2,367 | 14,043 | 49,145 | |
Workforce Employed | 3,760 | 28,049 | 84,160 | |
Workforce Unemployed | 252 | 1,650 | 6,727 | |
Civlian Workforce | 4,012 | 29,699 | 90,887 | |
Military Workforce | 0 | 37 | 350 | |
Total Households | 3,129 | 21,983 | 65,647 | |
Family Households | 1,829 | 10,552 | 31,233 | |
Non-Family Households | 1,300 | 11,431 | 34,414 | |
Married Couple | 905 | 5,128 | 14,786 | |
Other Family | 924 | 5,424 | 16,447 | |
Married w/Child | 346 | 1,729 | 4,701 | |
Single Male w/Child | 59 | 373 | 1,339 | |
Single Female w/Child | 364 | 2,185 | 6,888 |
Population Change Last Two Decades - Plus Projection
2000 | % | 2010 | % | 2020 | % | 2030 | |
---|---|---|---|---|---|---|---|
Virginia | 7,078,515 | +13 | 8,001,024 | +8 | 8,655,021 | +8 | 9,331,666 |
Chesterfield County | 259,903 | +22 | 316,236 | +12 | 353,841 | +12 | 396,647 |
Hanover County | 86,320 | +16 | 99,863 | +9 | 109,244 | +9 | 119,360 |
Henrico County | 262,300 | +17 | 306,935 | +8 | 332,103 | +9 | 363,259 |
King William County | 13,146 | +21 | 15,935 | +8 | 17,167 | +11 | 19,011 |
Richmond city | 197,790 | +3 | 204,214 | +14 | 232,533 | +6 | 245,483 |
Total Working Age Population:
Total Households:
Total Working Age Population:
Total Households:
Total Working Age Population:
Total Households: