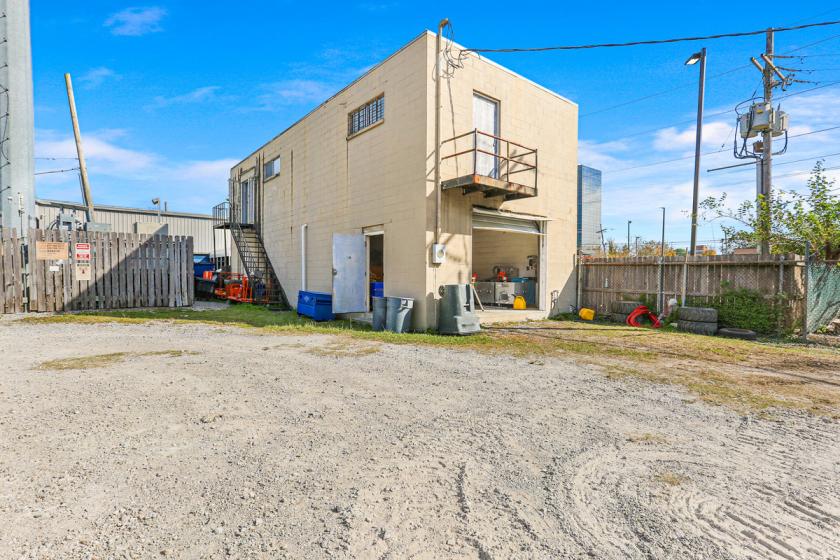
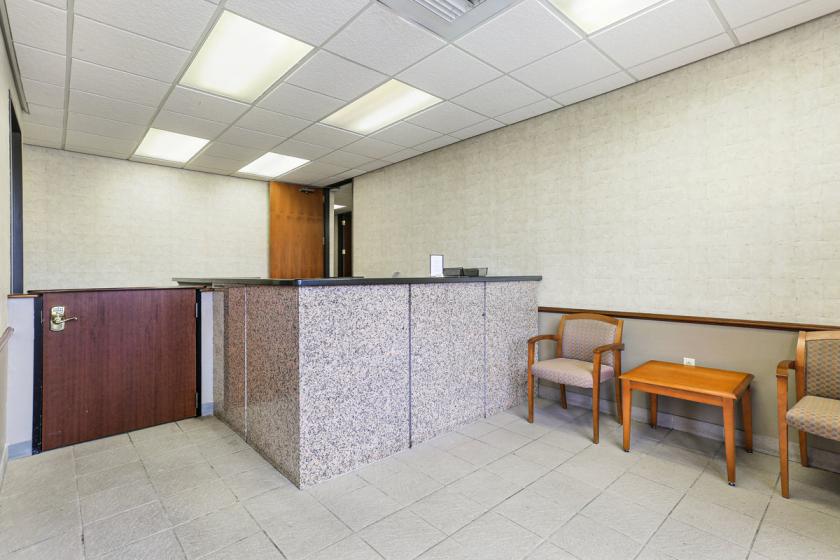
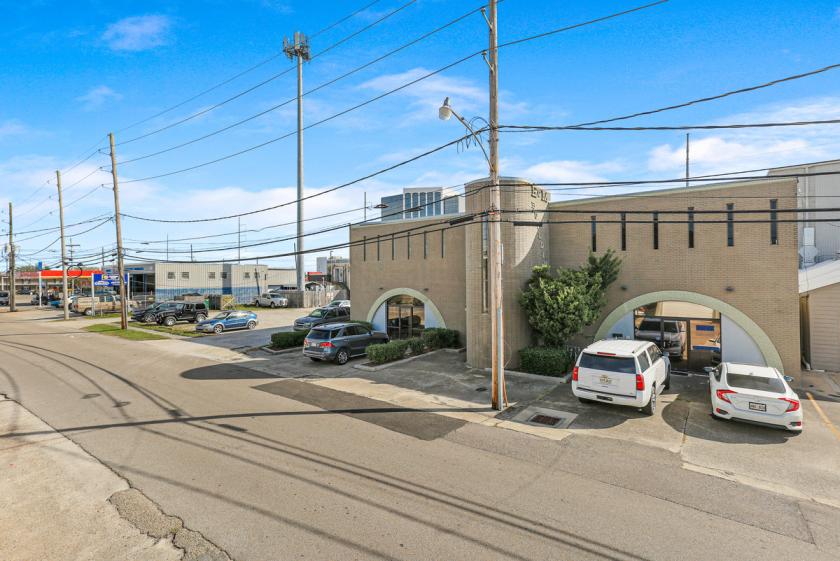
1-Mile | 3-Miles | 5-Miles | ||
---|---|---|---|---|
Total Population | 18,992 | 127,871 | 329,772 | |
Population Median Age | 41 | 41 | 40 | |
Population by Age | 0-9 Yrs | 2425 (12%) | 15153 (11%) | 36452 (11%) |
10-19 Yrs | 1288 (6%) | 11015 (8%) | 32451 (9%) | |
20-29 Yrs | 2705 (14%) | 17144 (13%) | 50865 (15%) | |
30-39 Yrs | 2926 (15%) | 21719 (16%) | 52188 (15%) | |
40-49 Yrs | 2307 (12%) | 14620 (11%) | 39715 (12%) | |
50-59 Yrs | 2524 (13%) | 17289 (13%) | 42210 (12%) | |
60-69 Yrs | 2539 (13%) | 16161 (12%) | 40599 (12%) | |
70+ Yrs | 2278 (11%) | 14770 (11%) | 35292 (10%) | |
Median HH Income | $67,560 | $58,659 | $50,877 | |
Total Household Income | < 24K | 1612 (18%) | 12157 (21%) | 37110 (27%) |
25-49K | 1754 (20%) | 12203 (22%) | 29861 (22%) | |
50-74K | 1314 (15%) | 8381 (15%) | 20381 (15%) | |
75-99K | 1142 (13%) | 6325 (11%) | 14105 (10%) | |
100-199K | 1824 (21%) | 11548 (20%) | 24683 (18%) | |
200K+ | 915 (10%) | 4817 (8%) | 9500 (7%) | |
Highest Education Level | No Diploma | 702 | 7916 | 27783 |
Diploma or GED | 3379 | 20299 | 54279 | |
Some College | 2397 | 19038 | 49029 | |
Assoc. Degree | 629 | 4526 | 10866 | |
Bachelors Degree | 4373 | 25573 | 57559 | |
Higher Degree | 3079 | 18710 | 39875 | |
Total Housing Units | 9,399 | 62,689 | 161,603 | |
--Owner-Occupied | 5,027 | 29,333 | 68,784 | |
--Renter-Occupied | 3,534 | 26,098 | 66,855 | |
Owner-Occupied Values | < 100K | 188 | 1775 | 4843 |
100-199K | 750 | 5228 | 16746 | |
200-299K | 1603 | 7761 | 19032 | |
300-399K | 806 | 5359 | 10847 | |
400-499K | 546 | 3025 | 6018 | |
500K+ | 1133 | 6185 | 11298 | |
Total Working Age Population | 15,764 | 106,035 | 274,686 | |
In Work Force | 10,927 | 71,392 | 175,221 | |
Not In Work Force | 4,837 | 34,643 | 99,465 | |
Workforce Employed | 10,492 | 68,178 | 164,250 | |
Workforce Unemployed | 423 | 3,063 | 10,363 | |
Civlian Workforce | 10,915 | 71,241 | 174,613 | |
Military Workforce | 12 | 152 | 608 | |
Total Households | 8,561 | 55,431 | 135,639 | |
Family Households | 4,537 | 29,194 | 68,308 | |
Non-Family Households | 4,023 | 26,237 | 67,331 | |
Married Couple | 3,351 | 20,723 | 44,233 | |
Other Family | 1,186 | 8,471 | 24,075 | |
Married w/Child | 1,295 | 7,610 | 15,324 | |
Single Male w/Child | 109 | 873 | 2,374 | |
Single Female w/Child | 397 | 3,335 | 9,487 |
Population Change Last Two Decades - Plus Projection
2000 | % | 2010 | % | 2020 | % | 2030 | |
---|---|---|---|---|---|---|---|
Louisiana | 4,468,976 | +1 | 4,533,372 | +1 | 4,588,310 | +5 | 4,813,420 |
Jefferson Parish | 455,466 | -5 | 432,552 | +4 | 450,200 | +1 | 454,670 |
Orleans Parish | 484,674 | -29 | 343,829 | -26 | 255,440 | 0 | 256,010 |
St. Charles Parish | 48,072 | +10 | 52,780 | +10 | 57,930 | +5 | 60,580 |
St. John the Baptist Parish | 43,044 | +7 | 45,924 | +25 | 57,410 | +13 | 65,110 |
Total Working Age Population:
Total Households:
Total Working Age Population:
Total Households:
Total Working Age Population:
Total Households: