Flex-Office-Warehouse
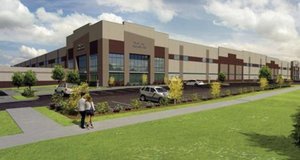
11040 Strang Line Road Lenexa, KS 66215
11040 Strang Line Road Lenexa, KS 66215

Details & Description
Listing Agents

Michael Block
O: 816-932-5549
mblock@blockllc.com
O: 816-932-5549
mblock@blockllc.com
While we strive to provide the most accurate information, all listing information, and demographic data, is provided by third-parties. As such, MyEListing will not be responsible for the accuracy of the information. It is strongly recommended that you verify all information with the listing agent, and any relevant agencies, prior to making any decisions.