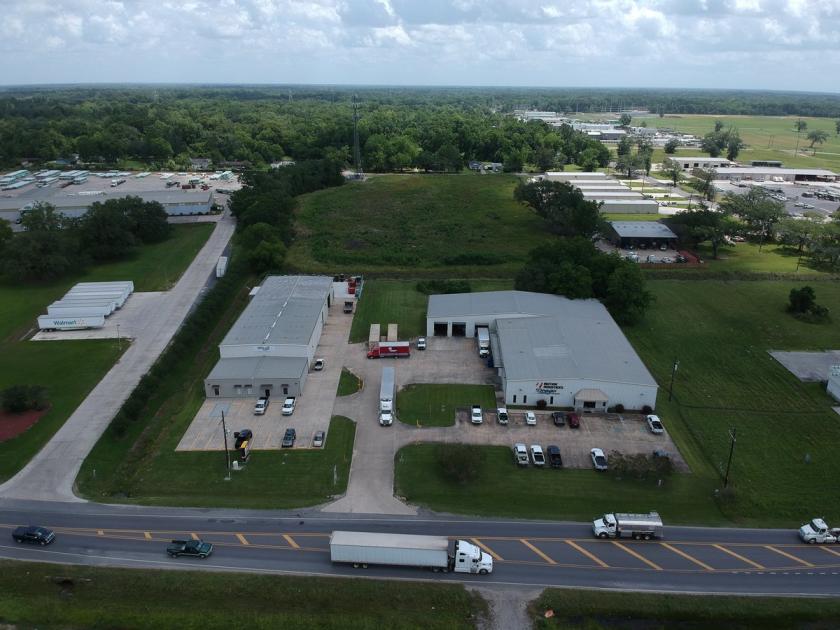
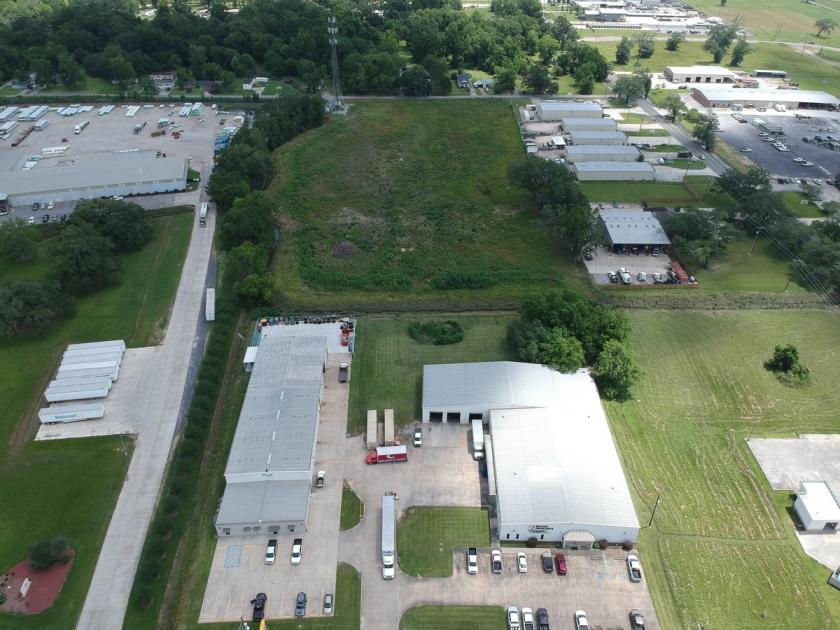
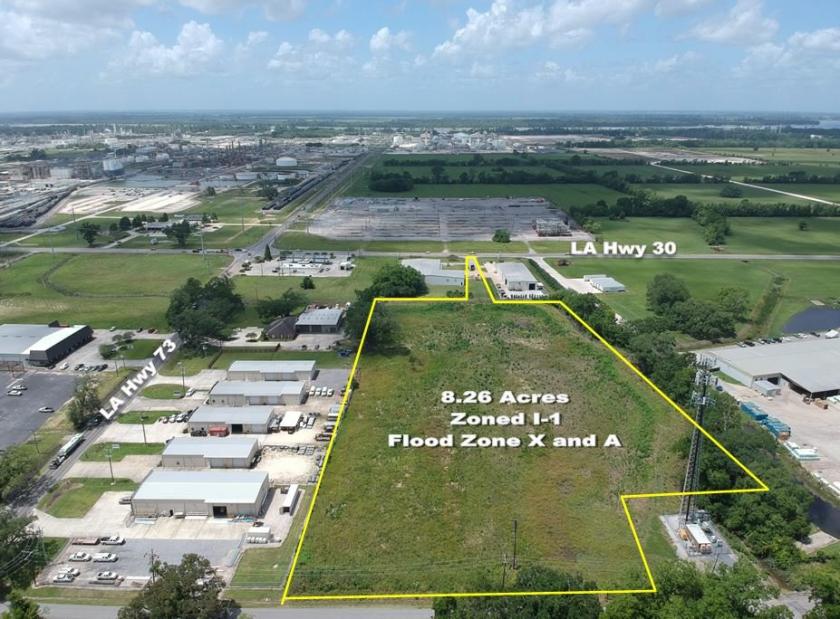
1-Mile | 3-Miles | 5-Miles | ||
---|---|---|---|---|
Total Population | 1,126 | 11,956 | 37,183 | |
Population Median Age | 33 | 35 | 36 | |
Population by Age | 0-9 Yrs | 169 (15%) | 1839 (15%) | 5102 (13%) |
10-19 Yrs | 237 (21%) | 2125 (17%) | 5846 (15%) | |
20-29 Yrs | 98 (8%) | 1349 (11%) | 4491 (12%) | |
30-39 Yrs | 138 (12%) | 1434 (11%) | 5288 (14%) | |
40-49 Yrs | 199 (17%) | 1893 (15%) | 5549 (14%) | |
50-59 Yrs | 153 (13%) | 1520 (12%) | 4841 (13%) | |
60-69 Yrs | 88 (7%) | 1123 (9%) | 3507 (9%) | |
70+ Yrs | 44 (3%) | 674 (5%) | 2558 (6%) | |
Median HH Income | $95,935 | $84,502 | $81,646 | |
Total Household Income | < 24K | 54 (14%) | 732 (18%) | 1936 (14%) |
25-49K | 23 (6%) | 498 (12%) | 1994 (15%) | |
50-74K | 31 (8%) | 451 (11%) | 1950 (15%) | |
75-99K | 92 (24%) | 919 (22%) | 2228 (17%) | |
100-199K | 143 (38%) | 1152 (28%) | 3729 (28%) | |
200K+ | 28 (7%) | 309 (7%) | 1108 (8%) | |
Highest Education Level | No Diploma | 36 | 672 | 2618 |
Diploma or GED | 204 | 2173 | 7156 | |
Some College | 169 | 1927 | 5923 | |
Assoc. Degree | 62 | 683 | 1891 | |
Bachelors Degree | 113 | 1191 | 4133 | |
Higher Degree | 77 | 744 | 2347 | |
Total Housing Units | 402 | 4,370 | 14,251 | |
--Owner-Occupied | 291 | 3,118 | 9,887 | |
--Renter-Occupied | 81 | 942 | 3,059 | |
Owner-Occupied Values | < 100K | 33 | 379 | 1257 |
100-199K | 33 | 701 | 3159 | |
200-299K | 125 | 1190 | 2988 | |
300-399K | 79 | 614 | 1581 | |
400-499K | 17 | 151 | 499 | |
500K+ | 4 | 83 | 402 | |
Total Working Age Population | 792 | 8,723 | 28,273 | |
In Work Force | 591 | 6,117 | 19,625 | |
Not In Work Force | 201 | 2,607 | 8,648 | |
Workforce Employed | 536 | 5,658 | 18,331 | |
Workforce Unemployed | 52 | 442 | 1,259 | |
Civlian Workforce | 588 | 6,100 | 19,590 | |
Military Workforce | 3 | 17 | 36 | |
Total Households | 371 | 4,059 | 12,945 | |
Family Households | 288 | 3,042 | 9,399 | |
Non-Family Households | 83 | 1,017 | 3,546 | |
Married Couple | 237 | 2,370 | 7,165 | |
Other Family | 51 | 673 | 2,234 | |
Married w/Child | 115 | 1,011 | 3,117 | |
Single Male w/Child | 12 | 95 | 322 | |
Single Female w/Child | 21 | 356 | 936 |
Population Change Last Two Decades - Plus Projection
2000 | % | 2010 | % | 2020 | % | 2030 | |
---|---|---|---|---|---|---|---|
Louisiana | 4,468,976 | +1 | 4,533,372 | +1 | 4,588,310 | +5 | 4,813,420 |
Ascension Parish | 76,627 | +40 | 107,215 | +38 | 147,740 | +33 | 196,140 |
Iberville Parish | 33,320 | 0 | 33,387 | -17 | 27,830 | -11 | 24,640 |
Livingston Parish | 91,814 | +39 | 128,026 | +40 | 179,820 | +35 | 242,780 |
St. James Parish | 21,216 | +4 | 22,102 | -6 | 20,830 | -6 | 19,670 |
Total Working Age Population:
Total Households:
Total Working Age Population:
Total Households:
Total Working Age Population:
Total Households: