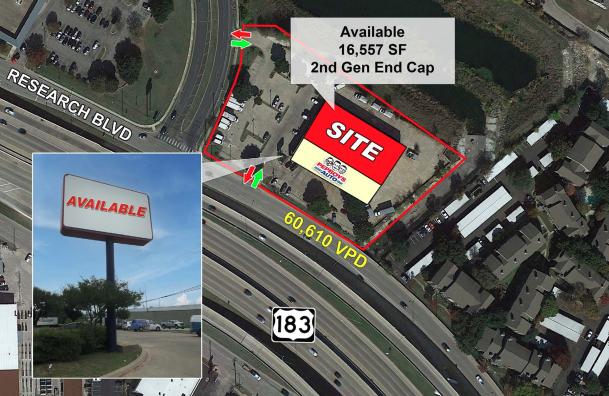
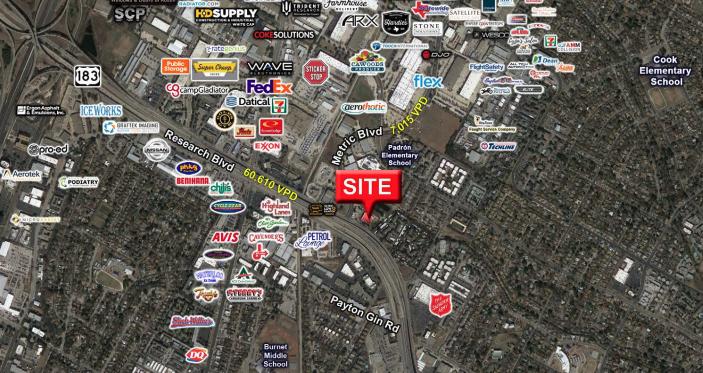
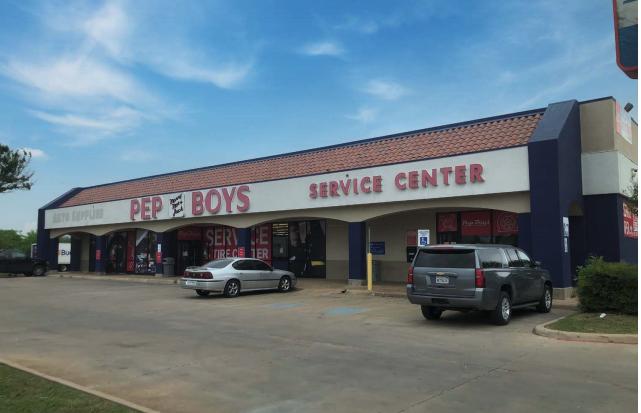
1-Mile | 3-Miles | 5-Miles | ||
---|---|---|---|---|
Total Population | 20,468 | 150,971 | 321,593 | |
Population Median Age | 33 | 35 | 36 | |
Population by Age | 0-9 Yrs | 3082 (15%) | 20099 (13%) | 40392 (12%) |
10-19 Yrs | 2714 (13%) | 14886 (9%) | 30151 (9%) | |
20-29 Yrs | 3636 (17%) | 27768 (18%) | 58540 (18%) | |
30-39 Yrs | 4147 (20%) | 31599 (20%) | 65729 (20%) | |
40-49 Yrs | 2650 (12%) | 19768 (13%) | 43887 (13%) | |
50-59 Yrs | 2137 (10%) | 16122 (10%) | 35979 (11%) | |
60-69 Yrs | 1217 (5%) | 11481 (7%) | 26427 (8%) | |
70+ Yrs | 885 (4%) | 9249 (6%) | 20487 (6%) | |
Median HH Income | $46,088 | $59,302 | $67,028 | |
Total Household Income | < 24K | 2333 (28%) | 11312 (17%) | 21321 (15%) |
25-49K | 1960 (24%) | 15050 (23%) | 28581 (21%) | |
50-74K | 1569 (19%) | 11741 (18%) | 25273 (18%) | |
75-99K | 604 (7%) | 7070 (11%) | 16240 (11%) | |
100-199K | 1345 (16%) | 13304 (21%) | 31430 (23%) | |
200K+ | 264 (3%) | 4611 (7%) | 13037 (9%) | |
Highest Education Level | No Diploma | 3255 | 16466 | 26363 |
Diploma or GED | 3320 | 20913 | 37839 | |
Some College | 2103 | 16845 | 37212 | |
Assoc. Degree | 620 | 6076 | 12222 | |
Bachelors Degree | 2856 | 29315 | 72168 | |
Higher Degree | 1279 | 18316 | 46787 | |
Total Housing Units | 8,806 | 68,475 | 147,601 | |
--Owner-Occupied | 2,235 | 22,545 | 55,203 | |
--Renter-Occupied | 5,840 | 40,543 | 80,680 | |
Owner-Occupied Values | < 100K | 59 | 1063 | 1898 |
100-199K | 529 | 4344 | 7965 | |
200-299K | 728 | 5380 | 12806 | |
300-399K | 543 | 3850 | 10278 | |
400-499K | 272 | 3076 | 7764 | |
500K+ | 105 | 4831 | 14492 | |
Total Working Age Population | 15,679 | 121,324 | 261,823 | |
In Work Force | 11,748 | 91,732 | 197,430 | |
Not In Work Force | 3,930 | 29,593 | 64,393 | |
Workforce Employed | 11,188 | 88,519 | 189,769 | |
Workforce Unemployed | 561 | 3,189 | 7,591 | |
Civlian Workforce | 11,748 | 91,709 | 197,360 | |
Military Workforce | 0 | 23 | 69 | |
Total Households | 8,076 | 63,088 | 135,882 | |
Family Households | 4,117 | 31,066 | 68,711 | |
Non-Family Households | 3,959 | 32,022 | 67,171 | |
Married Couple | 2,467 | 22,084 | 50,517 | |
Other Family | 1,649 | 8,982 | 18,195 | |
Married w/Child | 1,330 | 10,839 | 23,392 | |
Single Male w/Child | 251 | 1,259 | 2,666 | |
Single Female w/Child | 824 | 3,597 | 6,680 |
Population Change Last Two Decades - Plus Projection
2000 | % | 2010 | % | 2020 | % | 2030 | |
---|---|---|---|---|---|---|---|
Texas | 20,851,820 | +21 | 25,145,561 | +18 | 29,677,668 | +18 | 34,894,452 |
Bastrop County | 57,733 | +28 | 74,171 | +16 | 86,105 | +15 | 99,211 |
Hays County | 97,589 | +61 | 157,107 | +50 | 234,896 | +48 | 347,120 |
Travis County | 812,280 | +26 | 1,024,266 | +26 | 1,291,502 | +19 | 1,540,812 |
Williamson County | 249,967 | +69 | 422,679 | +40 | 589,914 | +41 | 830,421 |
Total Working Age Population:
Total Households:
Total Working Age Population:
Total Households:
Total Working Age Population:
Total Households: