Health Care and Medical Properties
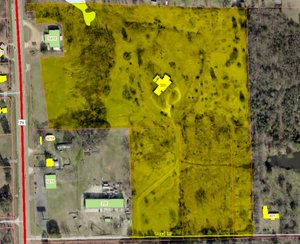
2024 North State Line Avenue Texarkana, AR 71854
2024 North State Line Avenue Texarkana, AR 71854

Details & Description
Additional Photos


Listing Agents

Jerry Brewer
O: 903-793-2666
M: 903-691-0941
jerry@amreal.com
O: 903-793-2666
M: 903-691-0941
jerry@amreal.com
While we strive to provide the most accurate information, all listing information, and demographic data, is provided by third-parties. As such, MyEListing will not be responsible for the accuracy of the information. It is strongly recommended that you verify all information with the listing agent, and any relevant agencies, prior to making any decisions.