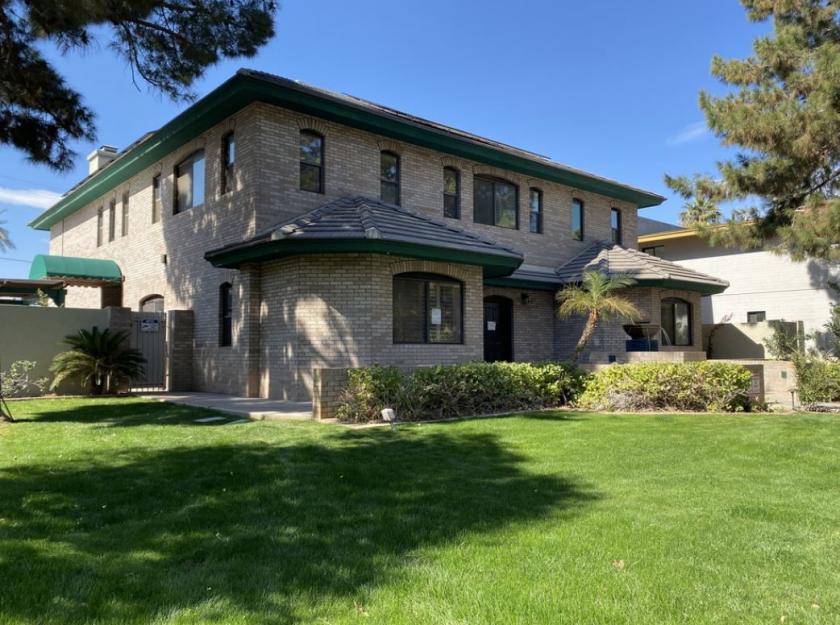
Office Space
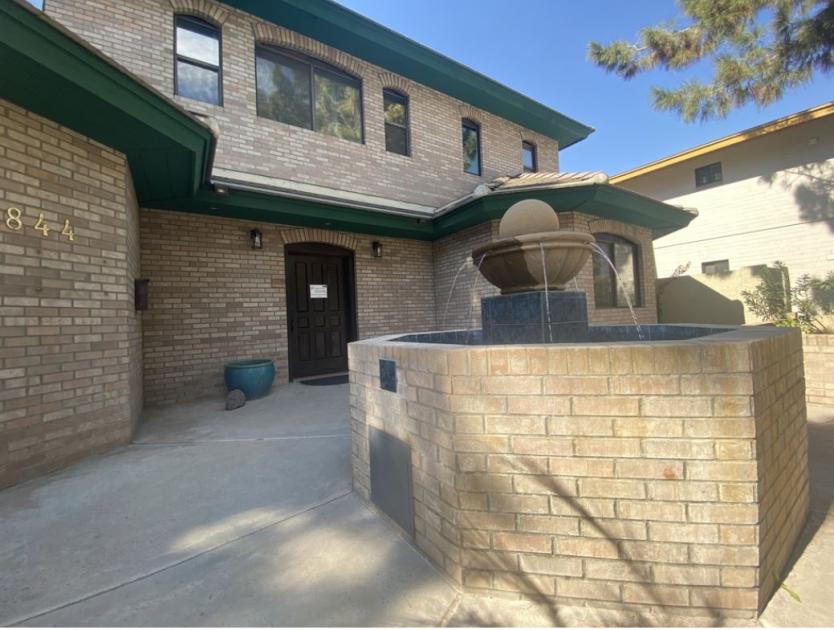
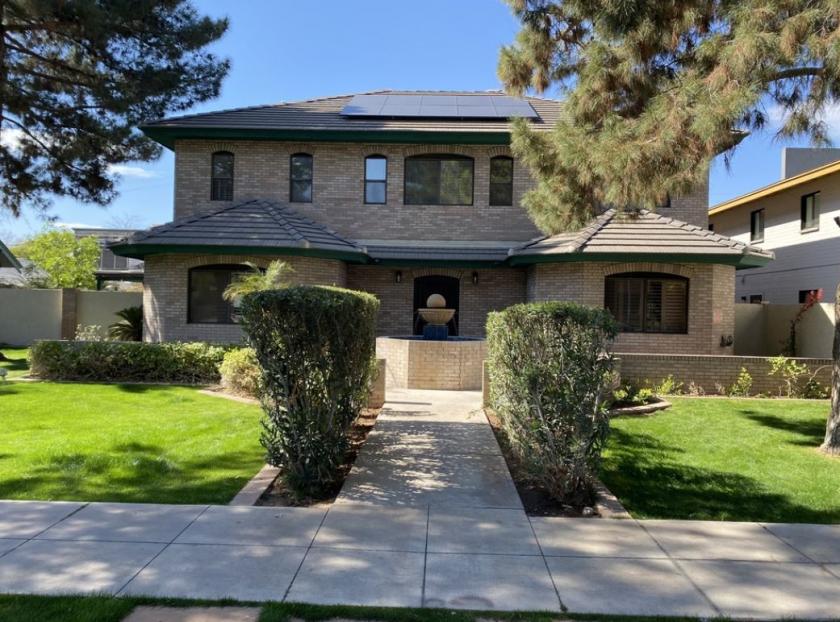
844 North 4th Avenue Phoenix, AZ 85003
844 North 4th Avenue Phoenix, AZ 85003
Details & Description
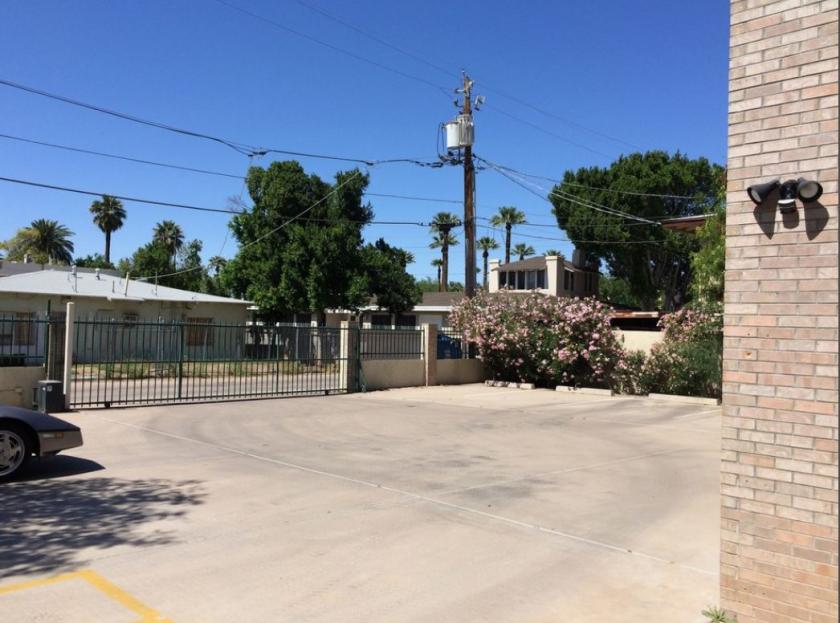
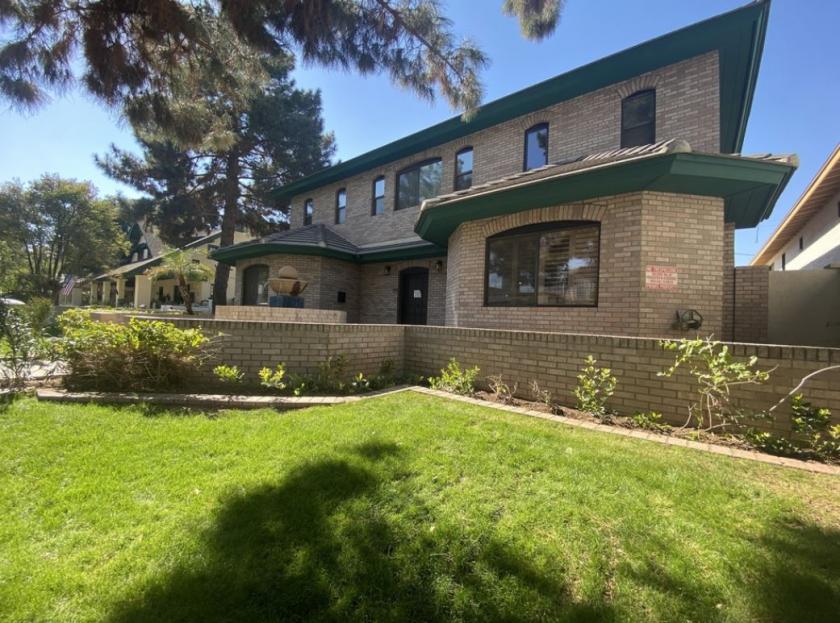
Additional Photos
Listing Agents

Justin Horwitz
O: 480-425-5518
M: 480-220-2674
justin.horwitz@svn.com
O: 480-425-5518
M: 480-220-2674
justin.horwitz@svn.com
While we strive to provide the most accurate information, all listing information, and demographic data, is provided by third-parties. As such, MyEListing will not be responsible for the accuracy of the information. It is strongly recommended that you verify all information with the listing agent, and any relevant agencies, prior to making any decisions.


