Highlights
Convenient to Lafayette and Baton Rouge
Excellent Ag/Hunting Land
2 Tracts - 144 Acres; 312 Acres
Leases in Place
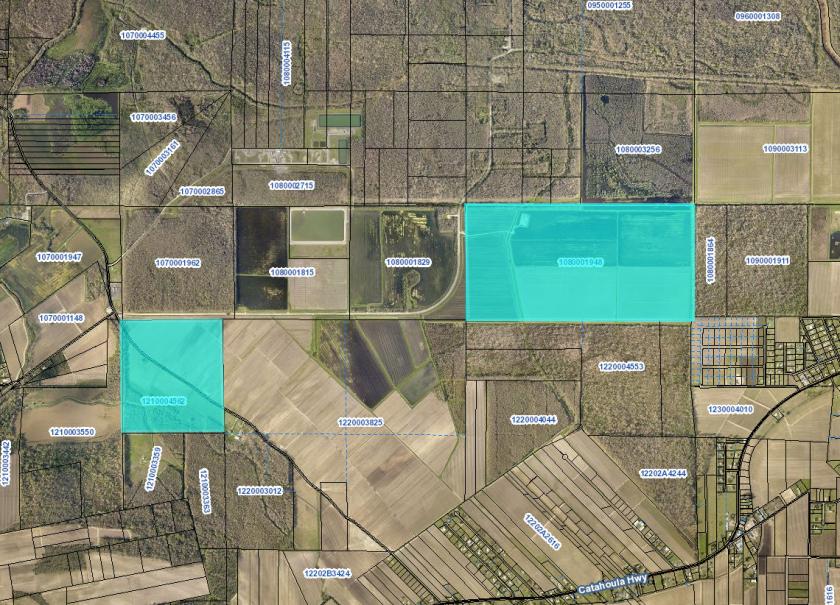
The subject property consists of two agricultural/recreational tracts located in St. Martin Parish, just west of Catahoula, LA. The two tracts combined are approximately 456 acres and excellent grazing, farming (crawfish and rice), and hunting land. There are surface leases in place for farming, grazing, and hunting.
Tract Description:
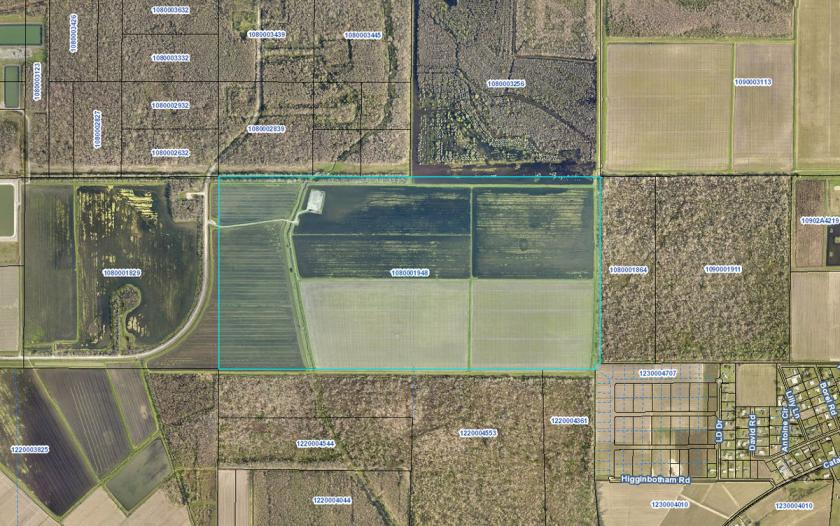
Lot 1080001948: 312 Acres - Rectangular shaped agricultural tract. Currently, this parcel has leases for crawfish and rice farming in addition to duck hunting.
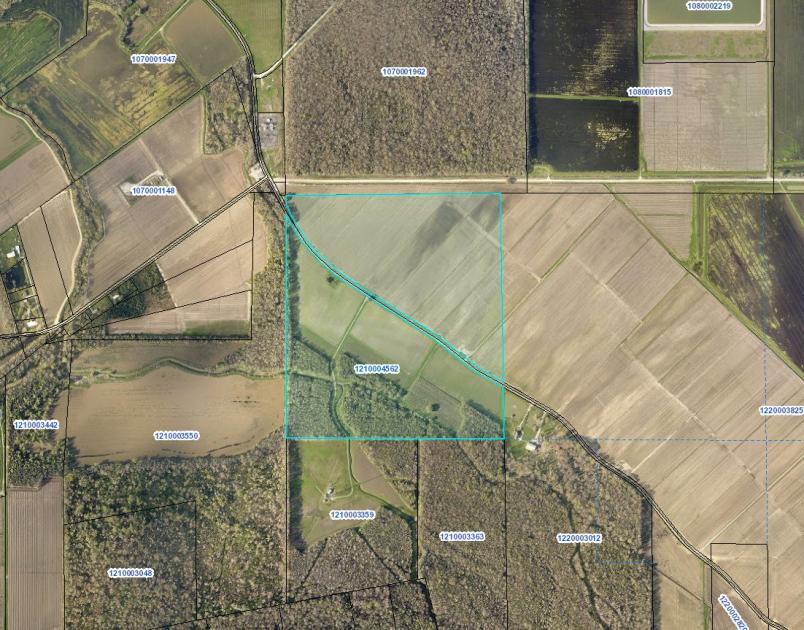
Lot 1210004562: 144 Acres - Square shaped lot with frontage on Section 28 Road. Section 28 Road transects the property diagonally.
No part of this information may be copied, reproduced, repurposed, or screen-captured for any commercial purpose without prior written authorization from MyEListing.
While we strive to provide the most accurate information, all listing information, and demographic data, is provided by third-parties. As such, MyEListing will not be responsible for the accuracy of the information. It is strongly recommended that you verify all information with the listing agent, and any relevant agencies, prior to making any decisions.
What is the asking price for Section 28 Rd in Saint Martinville?
The asking price for Section 28 Rd is $2,200,000
How much land does the Saint Martinville, LA property at Section 28 Rd include?
Section 28 Rd in Saint Martinville includes 456.000 acres of land
What kind of Land is the propery at Section 28 Rd?
The property at Section 28 Rd Saint Martinville, LA 70582 is listed as a Agricultural Land Land property
What is the population within 1 mile of Section 28 Rd in Saint Martinville?
The population within 1 mile of Section 28 Rd Saint Martinville, LA 70582 is 262 people.
Who do I contact for questions about Section 28 Rd?
You should contact the listing agent,
Evan Scroggs, for any details regarding this commercial listing.