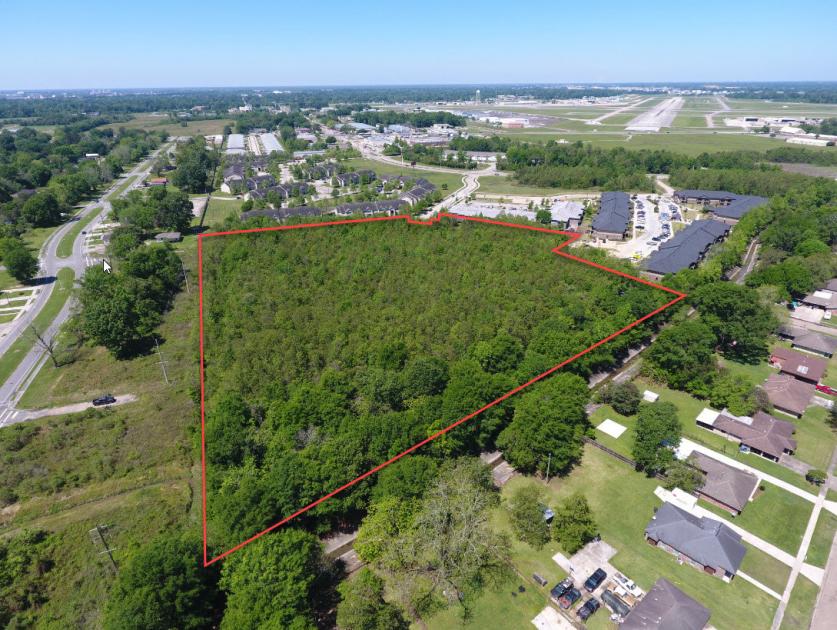
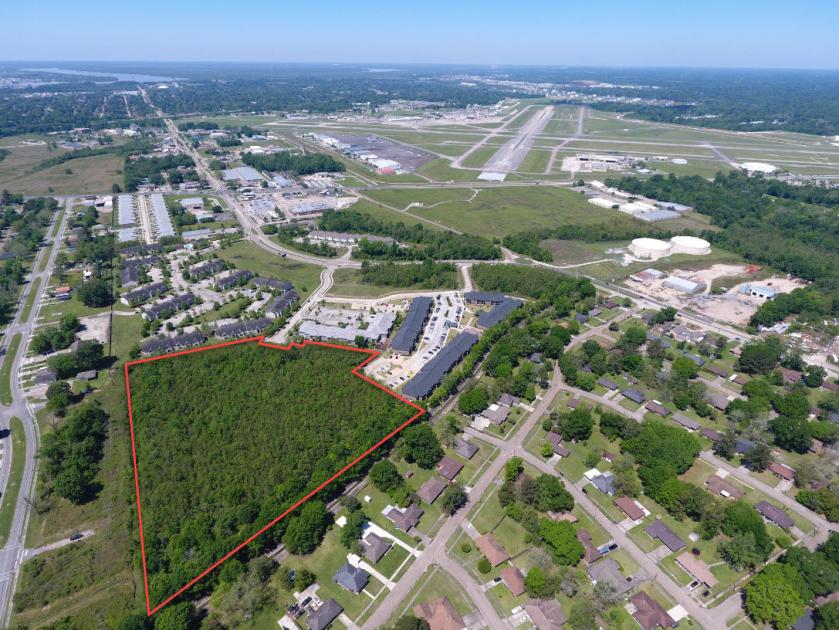
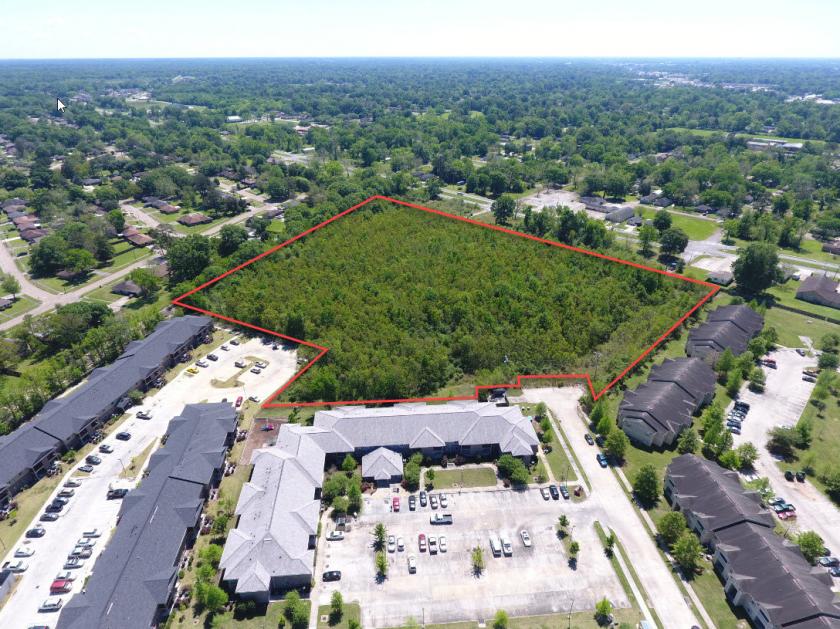
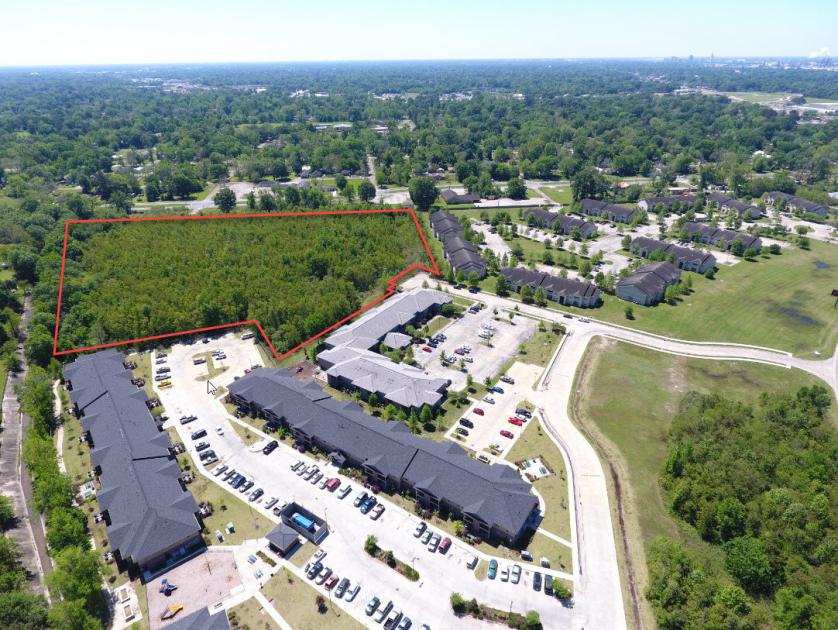
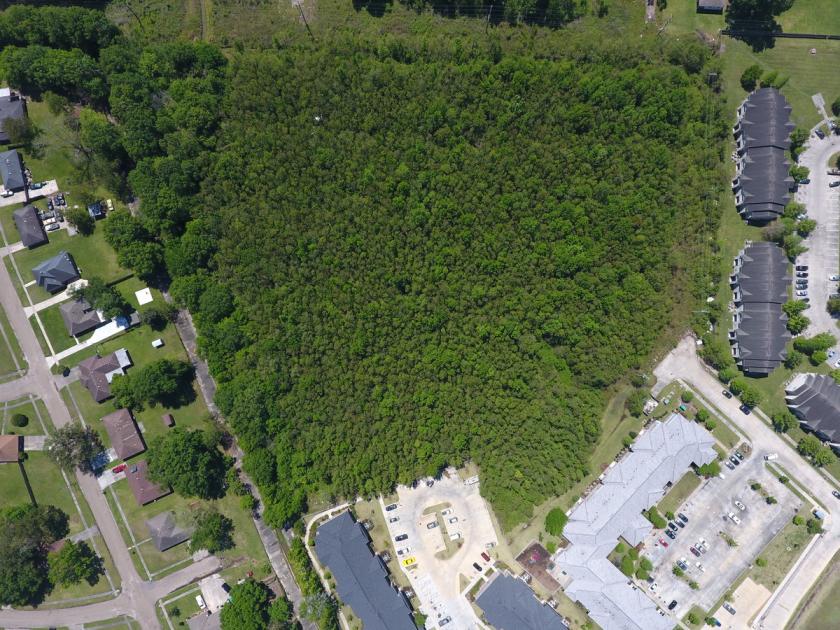
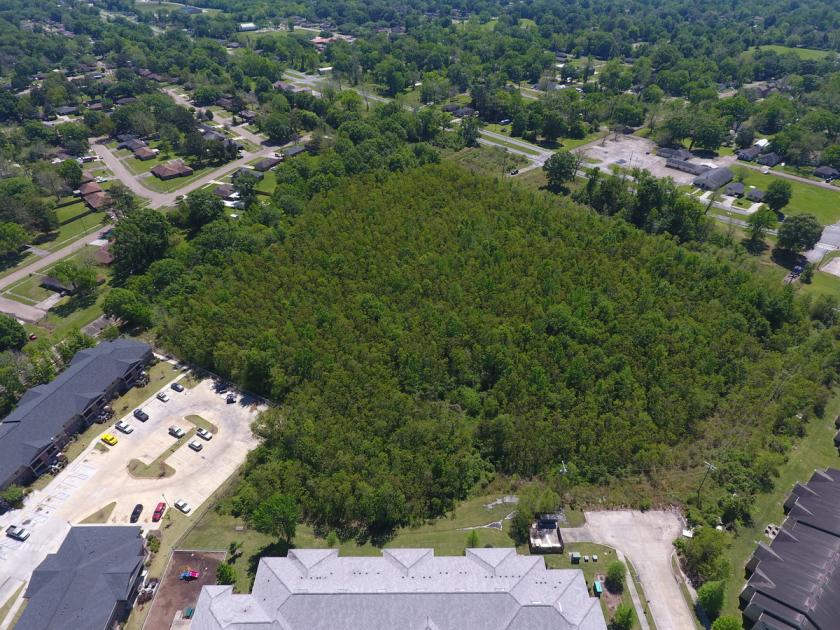
1-Mile | 3-Miles | 5-Miles | ||
---|---|---|---|---|
Total Population | 8,125 | 57,083 | 119,200 | |
Population Median Age | 35 | 35 | 36 | |
Population by Age | 0-9 Yrs | 1719 (21%) | 9185 (16%) | 17667 (14%) |
10-19 Yrs | 926 (11%) | 9110 (15%) | 17904 (15%) | |
20-29 Yrs | 1242 (15%) | 8774 (15%) | 19323 (16%) | |
30-39 Yrs | 802 (9%) | 6954 (12%) | 15151 (12%) | |
40-49 Yrs | 661 (8%) | 5281 (9%) | 11358 (9%) | |
50-59 Yrs | 1264 (15%) | 7708 (13%) | 16091 (13%) | |
60-69 Yrs | 742 (9%) | 5384 (9%) | 11756 (9%) | |
70+ Yrs | 769 (9%) | 4687 (8%) | 9951 (8%) | |
Median HH Income | $31,188 | $31,690 | $34,164 | |
Total Household Income | < 24K | 1043 (40%) | 7417 (40%) | 15191 (37%) |
25-49K | 780 (29%) | 4917 (26%) | 10992 (27%) | |
50-74K | 432 (16%) | 3075 (16%) | 6150 (15%) | |
75-99K | 212 (8%) | 1394 (7%) | 3565 (8%) | |
100-199K | 97 (3%) | 1243 (6%) | 3646 (9%) | |
200K+ | 40 (1%) | 331 (1%) | 785 (1%) | |
Highest Education Level | No Diploma | 835 | 6131 | 12825 |
Diploma or GED | 1615 | 13165 | 26875 | |
Some College | 1393 | 8391 | 18094 | |
Assoc. Degree | 365 | 1649 | 3979 | |
Bachelors Degree | 388 | 2616 | 6923 | |
Higher Degree | 110 | 1733 | 3783 | |
Total Housing Units | 2,878 | 22,116 | 48,513 | |
--Owner-Occupied | 1,142 | 9,244 | 20,743 | |
--Renter-Occupied | 1,463 | 9,133 | 19,587 | |
Owner-Occupied Values | < 100K | 725 | 4767 | 9506 |
100-199K | 330 | 3569 | 8587 | |
200-299K | 73 | 635 | 1867 | |
300-399K | 0 | 99 | 304 | |
400-499K | 0 | 20 | 107 | |
500K+ | 14 | 153 | 373 | |
Total Working Age Population | 5,774 | 42,696 | 91,987 | |
In Work Force | 3,420 | 25,246 | 56,460 | |
Not In Work Force | 2,355 | 17,450 | 35,526 | |
Workforce Employed | 2,856 | 21,892 | 49,874 | |
Workforce Unemployed | 564 | 3,338 | 6,473 | |
Civlian Workforce | 3,420 | 25,230 | 56,348 | |
Military Workforce | 0 | 16 | 113 | |
Total Households | 2,605 | 18,377 | 40,330 | |
Family Households | 1,760 | 12,048 | 24,947 | |
Non-Family Households | 845 | 6,329 | 15,383 | |
Married Couple | 582 | 4,867 | 10,552 | |
Other Family | 1,178 | 7,181 | 14,396 | |
Married w/Child | 168 | 1,420 | 2,988 | |
Single Male w/Child | 99 | 521 | 953 | |
Single Female w/Child | 515 | 3,018 | 5,912 |
Population Change Last Two Decades - Plus Projection
2000 | % | 2010 | % | 2020 | % | 2030 | |
---|---|---|---|---|---|---|---|
Louisiana | 4,468,976 | +1 | 4,533,372 | +1 | 4,588,310 | +5 | 4,813,420 |
East Baton Rouge Parish | 412,852 | +7 | 440,171 | -3 | 426,380 | -1 | 421,500 |
Iberville Parish | 33,320 | 0 | 33,387 | -17 | 27,830 | -11 | 24,640 |
St. Martin Parish | 48,583 | +7 | 52,160 | +6 | 55,520 | +3 | 57,000 |
West Baton Rouge Parish | 21,601 | +10 | 23,788 | -7 | 22,220 | -5 | 21,070 |
Total Working Age Population:
Total Households:
Total Working Age Population:
Total Households:
Total Working Age Population:
Total Households: