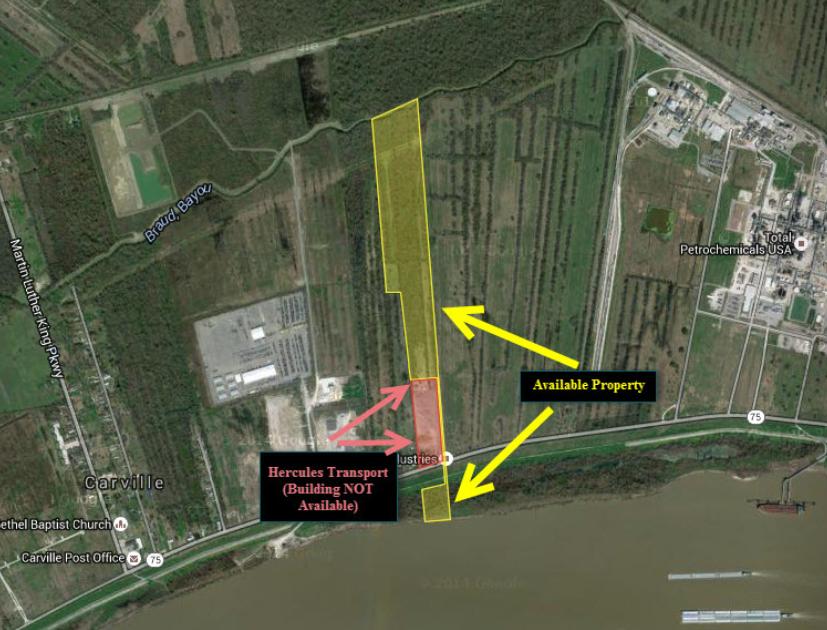
1-Mile | 3-Miles | 5-Miles | ||
---|---|---|---|---|
Total Population | 267 | 2,365 | 11,400 | |
Population Median Age | 34 | 36 | 39 | |
Population by Age | 0-9 Yrs | 28 (10%) | 264 (11%) | 973 (8%) |
10-19 Yrs | 47 (17%) | 375 (15%) | 1455 (12%) | |
20-29 Yrs | 64 (23%) | 450 (19%) | 1725 (15%) | |
30-39 Yrs | 19 (7%) | 254 (10%) | 1815 (15%) | |
40-49 Yrs | 41 (15%) | 344 (14%) | 1849 (16%) | |
50-59 Yrs | 22 (8%) | 248 (10%) | 1645 (14%) | |
60-69 Yrs | 34 (12%) | 285 (12%) | 1096 (9%) | |
70+ Yrs | 11 (4%) | 146 (6%) | 842 (7%) | |
Median HH Income | $32,264 | $42,101 | $69,479 | |
Total Household Income | < 24K | 33 (33%) | 236 (28%) | 651 (21%) |
25-49K | 26 (26%) | 192 (23%) | 514 (17%) | |
50-74K | 10 (10%) | 94 (11%) | 422 (14%) | |
75-99K | 20 (20%) | 165 (20%) | 542 (18%) | |
100-199K | 8 (8%) | 106 (12%) | 660 (22%) | |
200K+ | 2 (2%) | 32 (3%) | 210 (7%) | |
Highest Education Level | No Diploma | 26 | 253 | 1670 |
Diploma or GED | 44 | 456 | 2838 | |
Some College | 43 | 329 | 1575 | |
Assoc. Degree | 12 | 123 | 515 | |
Bachelors Degree | 10 | 140 | 912 | |
Higher Degree | 13 | 138 | 483 | |
Total Housing Units | 133 | 1,052 | 3,549 | |
--Owner-Occupied | 52 | 487 | 2,140 | |
--Renter-Occupied | 48 | 337 | 859 | |
Owner-Occupied Values | < 100K | 23 | 177 | 470 |
100-199K | 12 | 114 | 458 | |
200-299K | 8 | 103 | 588 | |
300-399K | 5 | 53 | 349 | |
400-499K | 0 | 9 | 138 | |
500K+ | 4 | 32 | 136 | |
Total Working Age Population | 219 | 1,918 | 9,561 | |
In Work Force | 113 | 980 | 4,109 | |
Not In Work Force | 106 | 939 | 5,452 | |
Workforce Employed | 92 | 839 | 3,753 | |
Workforce Unemployed | 9 | 70 | 252 | |
Civlian Workforce | 101 | 909 | 4,005 | |
Military Workforce | 12 | 71 | 104 | |
Total Households | 100 | 824 | 2,998 | |
Family Households | 49 | 462 | 2,043 | |
Non-Family Households | 51 | 362 | 955 | |
Married Couple | 28 | 305 | 1,496 | |
Other Family | 20 | 157 | 547 | |
Married w/Child | 16 | 152 | 630 | |
Single Male w/Child | 0 | 5 | 72 | |
Single Female w/Child | 6 | 43 | 161 |
Population Change Last Two Decades - Plus Projection
2000 | % | 2010 | % | 2020 | % | 2030 | |
---|---|---|---|---|---|---|---|
Louisiana | 4,468,976 | +1 | 4,533,372 | +1 | 4,588,310 | +5 | 4,813,420 |
Ascension Parish | 76,627 | +40 | 107,215 | +38 | 147,740 | +33 | 196,140 |
Iberville Parish | 33,320 | 0 | 33,387 | -17 | 27,830 | -11 | 24,640 |
St. Martin Parish | 48,583 | +7 | 52,160 | +6 | 55,520 | +3 | 57,000 |
Total Working Age Population:
Total Households:
Total Working Age Population:
Total Households:
Total Working Age Population:
Total Households: