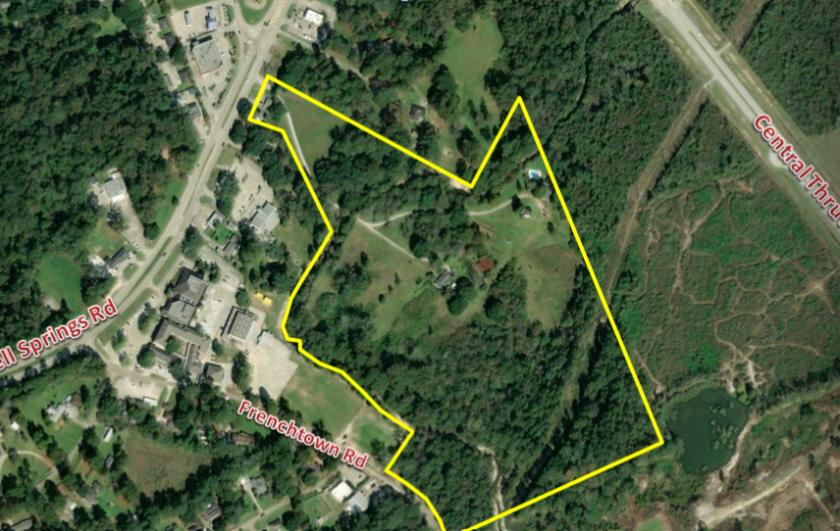
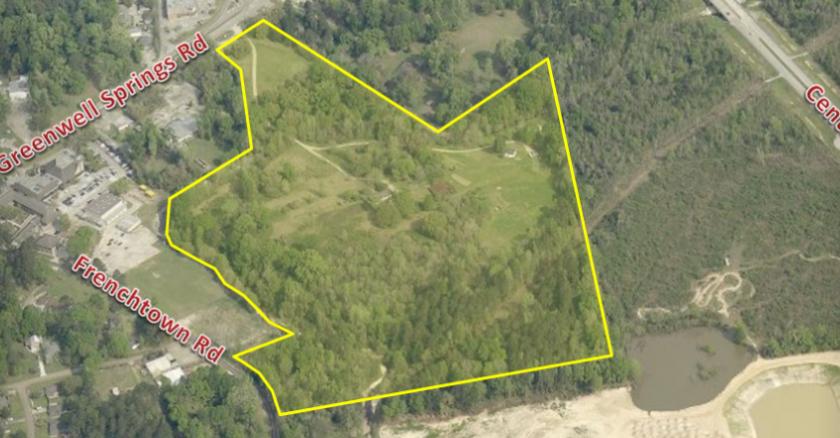
±43.456 Acres of Vacant land
• Additional ±1.325 Acres Included
• B4 Zoning - General Commercial Business Four
• Development Opportunity
• Two Potential Access Points
• Located between Greenwell Springs Rd and Central Thruway
• High Traffic Area
3 RESIDENTIAL Buildings located on the property:
• 3,661 SF - 4 Bedrooms 4 Bathrooms - Built in 2003 Remodeled in 2007
• 2,008 SF under roof, 825 SF living - 3 Bedrooms 2 Baths - Built in 1960 Remodeled in 2008
• 2,113 SF under roof, 1,168 SF living - 3 Bedrooms 2 Bathrooms - Built in 1962
2 COMMERCIAL Buildings located on the property:
• 1,057 SF under roof, 951 SF living - 2 Bedrooms 1 Bathroom - Built 1930
• Barber and Beauty Shop - 720 SF - Built in 1962
No part of this information may be copied, reproduced, repurposed, or screen-captured for any commercial purpose without prior written authorization from MyEListing.
While we strive to provide the most accurate information, all listing information, and demographic data, is provided by third-parties. As such, MyEListing will not be responsible for the accuracy of the information. It is strongly recommended that you verify all information with the listing agent, and any relevant agencies, prior to making any decisions.
What is the asking price for 14246 Greenwell Springs Road in Baton Rouge?
The asking price for 14246 Greenwell Springs Road is $1,861,703
How much land does the Baton Rouge, LA property at 14246 Greenwell Springs Road include?
14246 Greenwell Springs Road in Baton Rouge includes 43.460 acres of land
What kind of Land is the propery at 14246 Greenwell Springs Road?
The property at 14246 Greenwell Springs Road Baton Rouge, LA 70814 is listed as a Mixed Use Land Land property
What is the population within 1 mile of 14246 Greenwell Springs Road in Baton Rouge?
The population within 1 mile of 14246 Greenwell Springs Road Baton Rouge, LA 70814 is 2,893 people.
Who do I contact for questions about 14246 Greenwell Springs Road?
You should contact the listing agent,
Nelson Sanchez, for any details regarding this commercial listing.