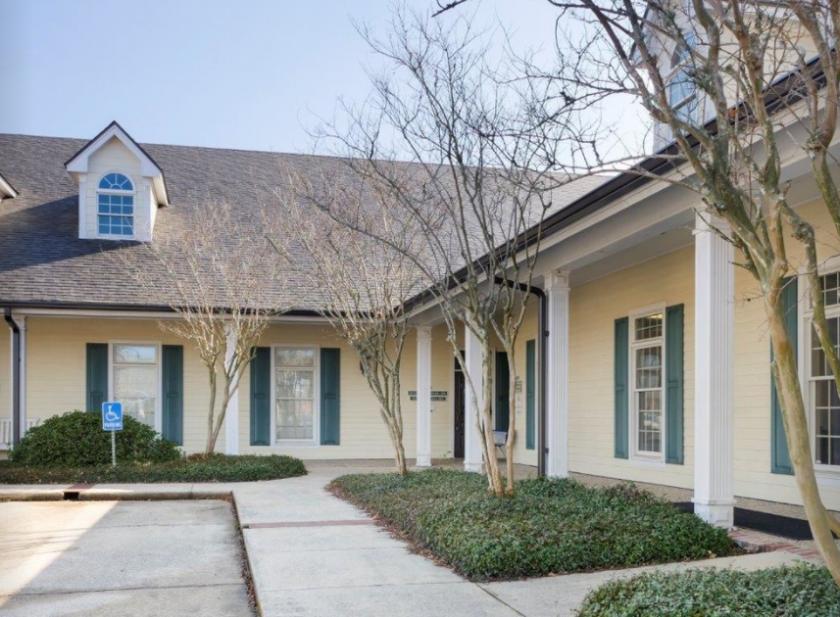
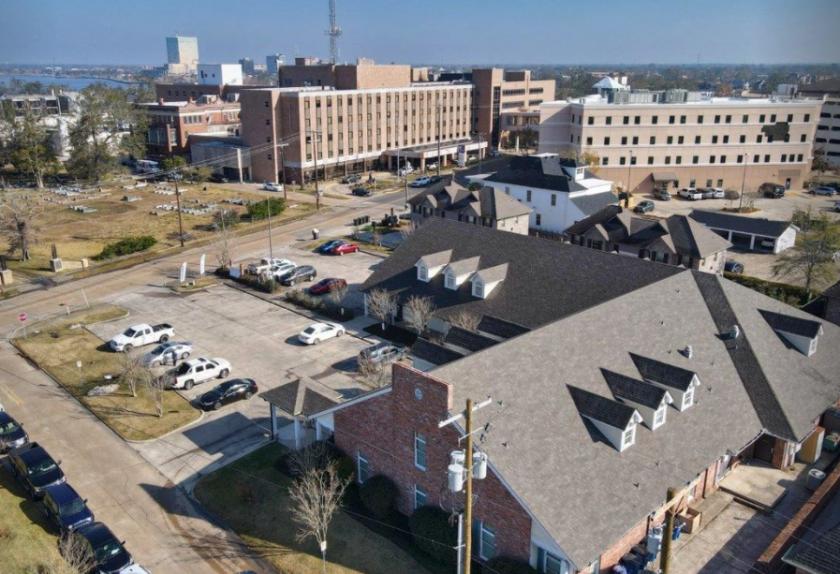
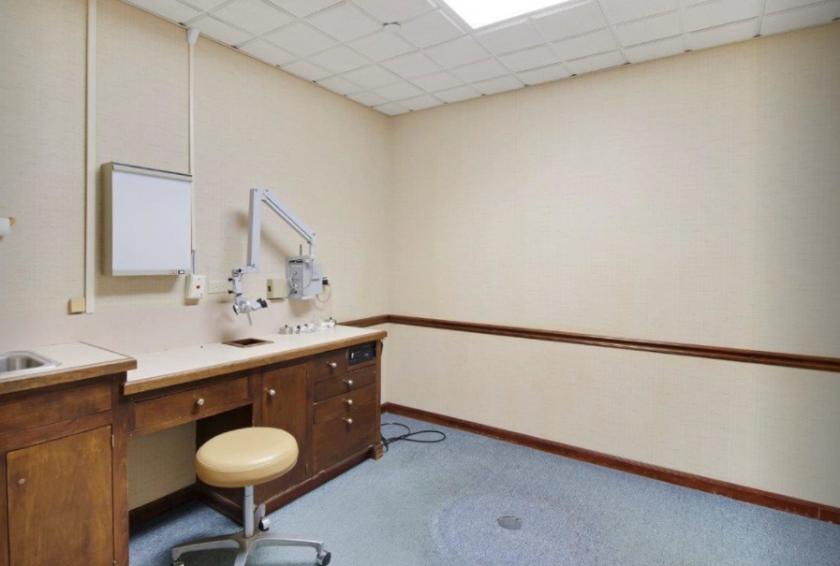
1-Mile | 3-Miles | 5-Miles | ||
---|---|---|---|---|
Total Population | 6,235 | 53,587 | 97,253 | |
Population Median Age | 41 | 39 | 38 | |
Population by Age | 0-9 Yrs | 707 (11%) | 6125 (11%) | 12593 (12%) |
10-19 Yrs | 393 (6%) | 6079 (11%) | 12104 (12%) | |
20-29 Yrs | 1174 (18%) | 9494 (17%) | 15415 (15%) | |
30-39 Yrs | 883 (14%) | 7506 (14%) | 13226 (13%) | |
40-49 Yrs | 662 (10%) | 5375 (10%) | 9929 (10%) | |
50-59 Yrs | 943 (15%) | 7175 (13%) | 13212 (13%) | |
60-69 Yrs | 789 (12%) | 6060 (11%) | 10527 (10%) | |
70+ Yrs | 685 (10%) | 5773 (10%) | 10247 (10%) | |
Median HH Income | $46,440 | $43,508 | $45,184 | |
Total Household Income | < 24K | 935 (28%) | 7688 (32%) | 12400 (30%) |
25-49K | 810 (24%) | 5558 (23%) | 9815 (23%) | |
50-74K | 545 (16%) | 3799 (16%) | 6665 (16%) | |
75-99K | 220 (6%) | 1927 (8%) | 3615 (8%) | |
100-199K | 496 (15%) | 3567 (15%) | 6421 (15%) | |
200K+ | 238 (7%) | 1164 (4%) | 1995 (4%) | |
Highest Education Level | No Diploma | 497 | 4407 | 8590 |
Diploma or GED | 1341 | 10969 | 19743 | |
Some College | 1119 | 8762 | 15371 | |
Assoc. Degree | 205 | 2349 | 4294 | |
Bachelors Degree | 1101 | 6675 | 11242 | |
Higher Degree | 612 | 3812 | 6549 | |
Total Housing Units | 3,707 | 26,868 | 46,981 | |
--Owner-Occupied | 1,502 | 12,948 | 23,774 | |
--Renter-Occupied | 1,743 | 10,754 | 17,137 | |
Owner-Occupied Values | < 100K | 290 | 3417 | 6309 |
100-199K | 472 | 5176 | 9475 | |
200-299K | 354 | 2462 | 4320 | |
300-399K | 139 | 966 | 1943 | |
400-499K | 86 | 348 | 781 | |
500K+ | 161 | 579 | 946 | |
Total Working Age Population | 5,205 | 43,876 | 77,220 | |
In Work Force | 3,500 | 27,336 | 47,578 | |
Not In Work Force | 1,705 | 16,539 | 29,642 | |
Workforce Employed | 3,420 | 25,565 | 44,562 | |
Workforce Unemployed | 79 | 1,723 | 2,966 | |
Civlian Workforce | 3,500 | 27,288 | 47,528 | |
Military Workforce | 0 | 48 | 50 | |
Total Households | 3,246 | 23,702 | 40,912 | |
Family Households | 1,282 | 12,395 | 23,319 | |
Non-Family Households | 1,964 | 11,307 | 17,592 | |
Married Couple | 876 | 7,369 | 14,282 | |
Other Family | 406 | 5,025 | 9,038 | |
Married w/Child | 269 | 2,251 | 4,742 | |
Single Male w/Child | 21 | 506 | 947 | |
Single Female w/Child | 225 | 2,137 | 4,150 |
Population Change Last Two Decades - Plus Projection
2000 | % | 2010 | % | 2020 | % | 2030 | |
---|---|---|---|---|---|---|---|
Louisiana | 4,468,976 | +1 | 4,533,372 | +1 | 4,588,310 | +5 | 4,813,420 |
Calcasieu Parish | 183,577 | +5 | 192,768 | -5 | 183,740 | -2 | 179,420 |
Total Working Age Population:
Total Households:
Total Working Age Population:
Total Households:
Total Working Age Population:
Total Households: