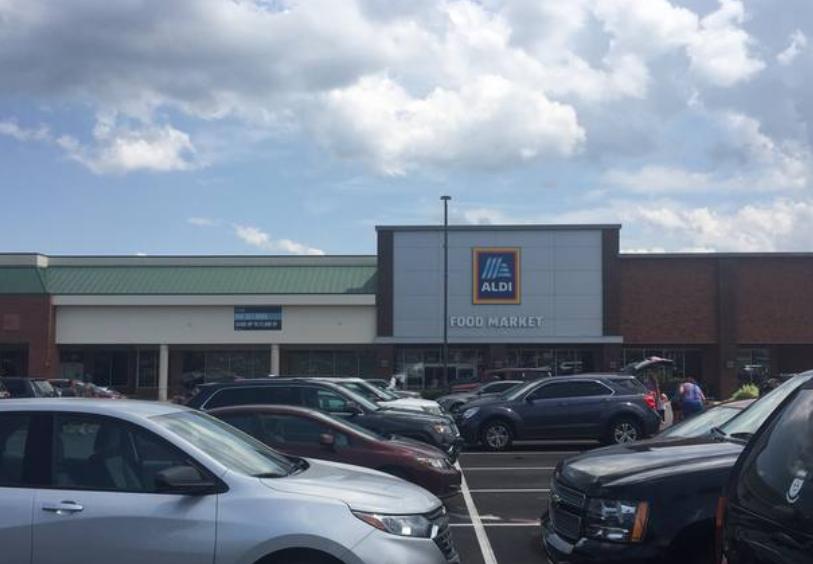
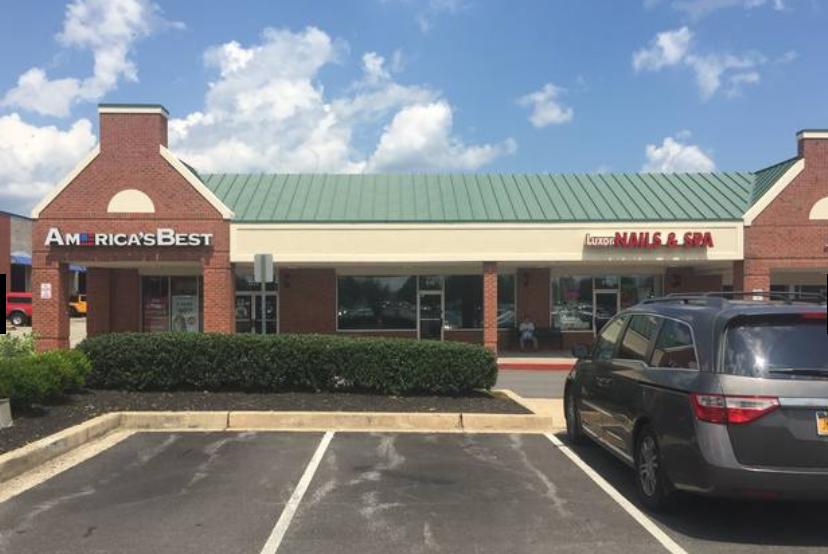
1-Mile | 3-Miles | 5-Miles | ||
---|---|---|---|---|
Total Population | 6,052 | 60,288 | 109,745 | |
Population Median Age | 44 | 40 | 40 | |
Population by Age | 0-9 Yrs | 535 (8%) | 6666 (11%) | 12611 (11%) |
10-19 Yrs | 771 (12%) | 8563 (14%) | 15286 (13%) | |
20-29 Yrs | 603 (9%) | 6684 (11%) | 11791 (10%) | |
30-39 Yrs | 588 (9%) | 6911 (11%) | 13176 (12%) | |
40-49 Yrs | 728 (12%) | 7996 (13%) | 15204 (13%) | |
50-59 Yrs | 978 (16%) | 9288 (15%) | 16282 (14%) | |
60-69 Yrs | 869 (14%) | 6906 (11%) | 13003 (11%) | |
70+ Yrs | 979 (16%) | 7275 (12%) | 12392 (11%) | |
Median HH Income | $83,764 | $95,791 | $98,093 | |
Total Household Income | < 24K | 398 (15%) | 2566 (11%) | 4232 (10%) |
25-49K | 386 (15%) | 3353 (14%) | 5511 (13%) | |
50-74K | 373 (14%) | 3135 (13%) | 5824 (14%) | |
75-99K | 299 (11%) | 2797 (12%) | 5415 (13%) | |
100-199K | 846 (33%) | 8055 (35%) | 14720 (35%) | |
200K+ | 222 (8%) | 2855 (12%) | 5437 (13%) | |
Highest Education Level | No Diploma | 339 | 2212 | 4140 |
Diploma or GED | 1162 | 9888 | 18300 | |
Some College | 808 | 8157 | 14661 | |
Assoc. Degree | 440 | 3656 | 6584 | |
Bachelors Degree | 972 | 10191 | 19105 | |
Higher Degree | 733 | 7668 | 13358 | |
Total Housing Units | 2,667 | 23,838 | 42,778 | |
--Owner-Occupied | 1,890 | 18,143 | 34,049 | |
--Renter-Occupied | 635 | 4,618 | 7,091 | |
Owner-Occupied Values | < 100K | 19 | 385 | 697 |
100-199K | 344 | 2168 | 4308 | |
200-299K | 503 | 5362 | 10459 | |
300-399K | 512 | 5100 | 8876 | |
400-499K | 350 | 3601 | 5936 | |
500K+ | 161 | 1528 | 3772 | |
Total Working Age Population | 5,027 | 48,634 | 87,812 | |
In Work Force | 3,167 | 32,587 | 59,639 | |
Not In Work Force | 1,860 | 16,047 | 28,173 | |
Workforce Employed | 3,021 | 31,044 | 57,142 | |
Workforce Unemployed | 125 | 1,425 | 2,191 | |
Civlian Workforce | 3,146 | 32,469 | 59,332 | |
Military Workforce | 21 | 118 | 307 | |
Total Households | 2,525 | 22,761 | 41,139 | |
Family Households | 1,664 | 16,201 | 29,793 | |
Non-Family Households | 861 | 6,561 | 11,346 | |
Married Couple | 1,300 | 13,305 | 24,937 | |
Other Family | 365 | 2,896 | 4,857 | |
Married w/Child | 405 | 5,597 | 10,746 | |
Single Male w/Child | 30 | 474 | 648 | |
Single Female w/Child | 144 | 1,069 | 1,846 |
Population Change Last Two Decades - Plus Projection
2000 | % | 2010 | % | 2020 | % | 2030 | |
---|---|---|---|---|---|---|---|
Maryland | 5,296,486 | +9 | 5,773,552 | +6 | 6,141,900 | +6 | 6,518,750 |
Baltimore County | 754,292 | +7 | 805,029 | +5 | 847,000 | +2 | 862,200 |
Harford County | 218,590 | +12 | 244,826 | +5 | 257,700 | +5 | 271,850 |
Total Working Age Population:
Total Households:
Total Working Age Population:
Total Households:
Total Working Age Population:
Total Households: