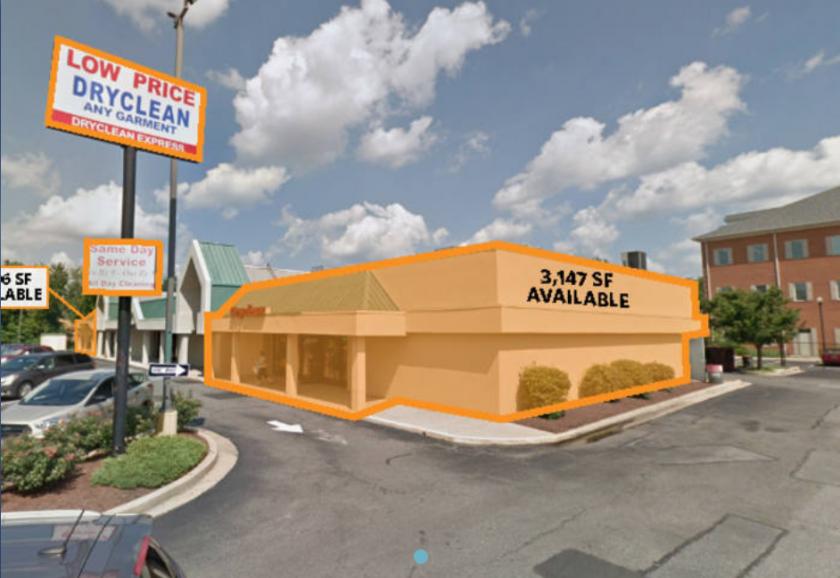
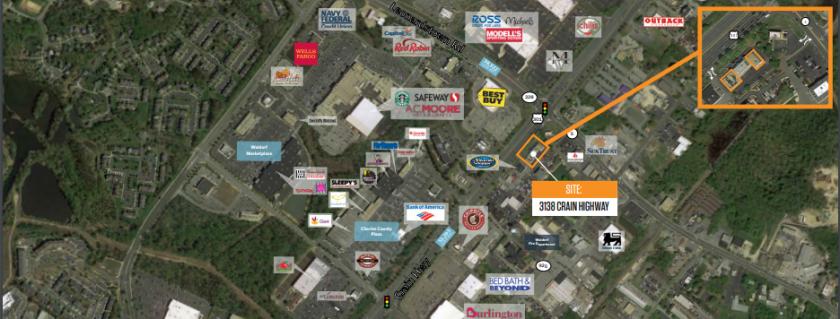
1-Mile | 3-Miles | 5-Miles | ||
---|---|---|---|---|
Total Population | 7,163 | 61,001 | 89,868 | |
Population Median Age | 34 | 35 | 36 | |
Population by Age | 0-9 Yrs | 1166 (16%) | 8619 (14%) | 12423 (13%) |
10-19 Yrs | 881 (12%) | 8550 (14%) | 12444 (13%) | |
20-29 Yrs | 1212 (16%) | 8993 (14%) | 12103 (13%) | |
30-39 Yrs | 1111 (15%) | 8835 (14%) | 12827 (14%) | |
40-49 Yrs | 993 (13%) | 8917 (14%) | 13198 (14%) | |
50-59 Yrs | 904 (12%) | 8401 (13%) | 12997 (14%) | |
60-69 Yrs | 620 (8%) | 5680 (9%) | 8762 (9%) | |
70+ Yrs | 275 (3%) | 3006 (4%) | 5113 (5%) | |
Median HH Income | $90,792 | $93,337 | $99,720 | |
Total Household Income | < 24K | 302 (11%) | 2054 (9%) | 2761 (8%) |
25-49K | 335 (12%) | 2993 (13%) | 3799 (11%) | |
50-74K | 454 (17%) | 3770 (16%) | 4848 (14%) | |
75-99K | 371 (13%) | 3306 (14%) | 4970 (15%) | |
100-199K | 979 (36%) | 8230 (36%) | 12402 (37%) | |
200K+ | 210 (7%) | 2132 (9%) | 3865 (11%) | |
Highest Education Level | No Diploma | 286 | 2331 | 3431 |
Diploma or GED | 1265 | 11606 | 17150 | |
Some College | 1192 | 10521 | 15228 | |
Assoc. Degree | 345 | 3625 | 5436 | |
Bachelors Degree | 842 | 6745 | 10567 | |
Higher Degree | 534 | 4754 | 7581 | |
Total Housing Units | 2,810 | 23,747 | 34,425 | |
--Owner-Occupied | 1,853 | 15,358 | 23,617 | |
--Renter-Occupied | 798 | 7,128 | 9,027 | |
Owner-Occupied Values | < 100K | 50 | 522 | 713 |
100-199K | 432 | 2830 | 3282 | |
200-299K | 654 | 6110 | 8365 | |
300-399K | 582 | 4235 | 7214 | |
400-499K | 114 | 1274 | 3009 | |
500K+ | 22 | 387 | 1034 | |
Total Working Age Population | 5,446 | 47,176 | 69,886 | |
In Work Force | 4,047 | 34,483 | 50,378 | |
Not In Work Force | 1,399 | 12,694 | 19,508 | |
Workforce Employed | 3,852 | 32,563 | 47,627 | |
Workforce Unemployed | 134 | 1,323 | 1,804 | |
Civlian Workforce | 3,986 | 33,886 | 49,431 | |
Military Workforce | 62 | 597 | 947 | |
Total Households | 2,651 | 22,486 | 32,644 | |
Family Households | 1,847 | 15,628 | 23,317 | |
Non-Family Households | 804 | 6,858 | 9,327 | |
Married Couple | 1,101 | 9,717 | 15,375 | |
Other Family | 745 | 5,911 | 7,942 | |
Married w/Child | 548 | 4,447 | 6,830 | |
Single Male w/Child | 70 | 482 | 663 | |
Single Female w/Child | 288 | 2,850 | 3,684 |
Population Change Last Two Decades - Plus Projection
2000 | % | 2010 | % | 2020 | % | 2030 | |
---|---|---|---|---|---|---|---|
Maryland | 5,296,486 | +9 | 5,773,552 | +6 | 6,141,900 | +6 | 6,518,750 |
Charles County | 120,546 | +22 | 146,551 | +14 | 167,050 | +17 | 194,650 |
Prince Georges County | 801,515 | +8 | 863,420 | +6 | 916,150 | +4 | 952,950 |
Total Working Age Population:
Total Households:
Total Working Age Population:
Total Households:
Total Working Age Population:
Total Households: