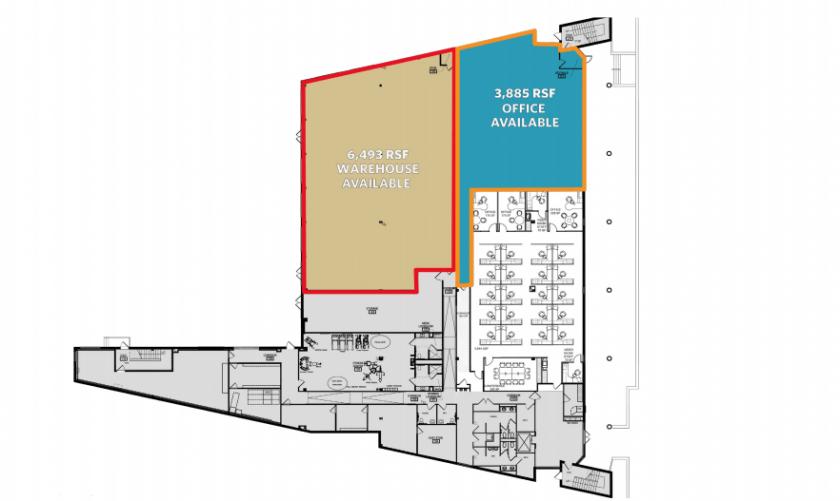
• Total of 10,378 RSF of flex / office space on the ground floor
• Warehouse: Approx. 6,493 RSF
• Office: Approx. 3,885 RSF
• 2 drive-in doors can easily be created
• Ceiling Heights: 12 - 15’, warehouse is fully air-conditioned
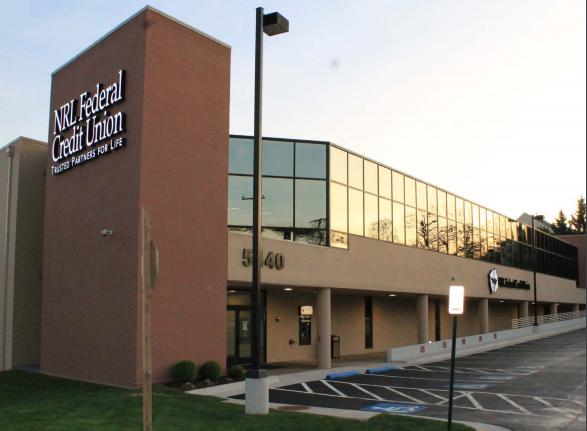
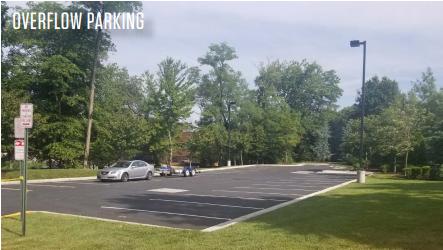
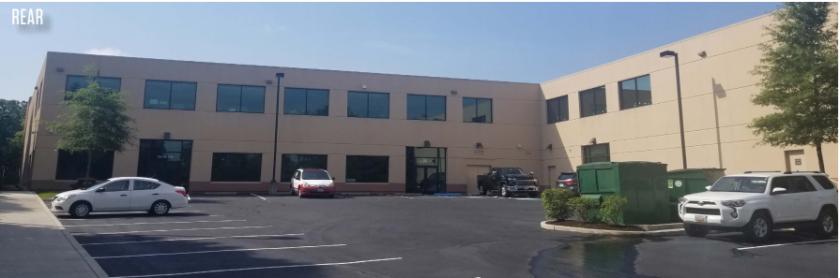
• Abundant Parking • Great inside the Beltway location – Great Access to I-395 & I-495
• Tenant Fitness Facility Available
• Asking Rates: $19.00 - $23.00 psf full service
No part of this information may be copied, reproduced, repurposed, or screen-captured for any commercial purpose without prior written authorization from MyEListing.
While we strive to provide the most accurate information, all listing information, and demographic data, is provided by third-parties. As such, MyEListing will not be responsible for the accuracy of the information. It is strongly recommended that you verify all information with the listing agent, and any relevant agencies, prior to making any decisions.
What is the asking price for 5440 Cherokee Avenue in Alexandria?
The asking price for 5440 Cherokee Avenue is $19.00 - $23.00 a SF per Year
What is the building size of this commercial Flex/Office Whs property?
The size of this multi-unit property varies between 3885 - 10378 square feet
What is the population within 1 mile of 5440 Cherokee Avenue in Alexandria?
The population within 1 mile of 5440 Cherokee Avenue Alexandria, VA 22312 is 12,172 people.
Who do I contact for questions about 5440 Cherokee Avenue?
You should contact the listing agent,
Jack Regler, for any details regarding this commercial listing.