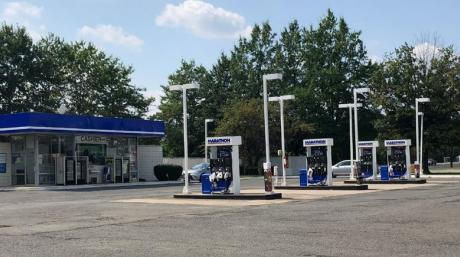
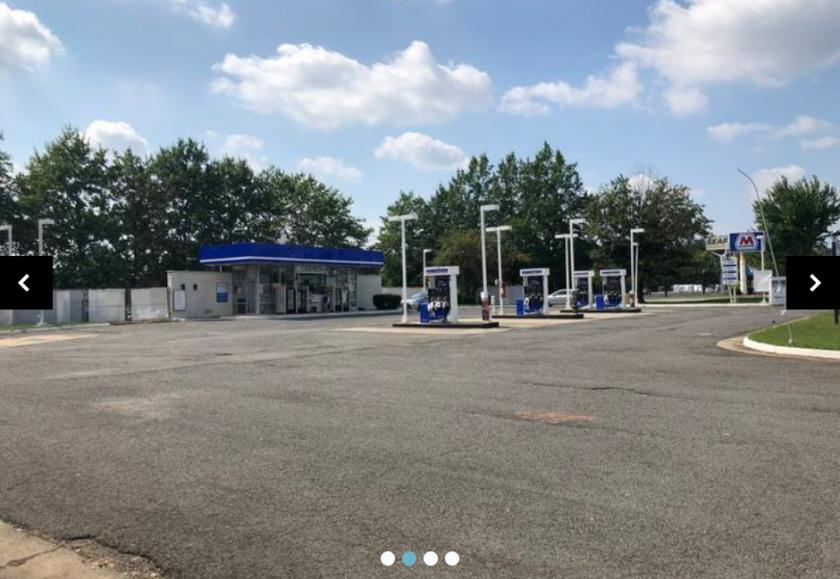
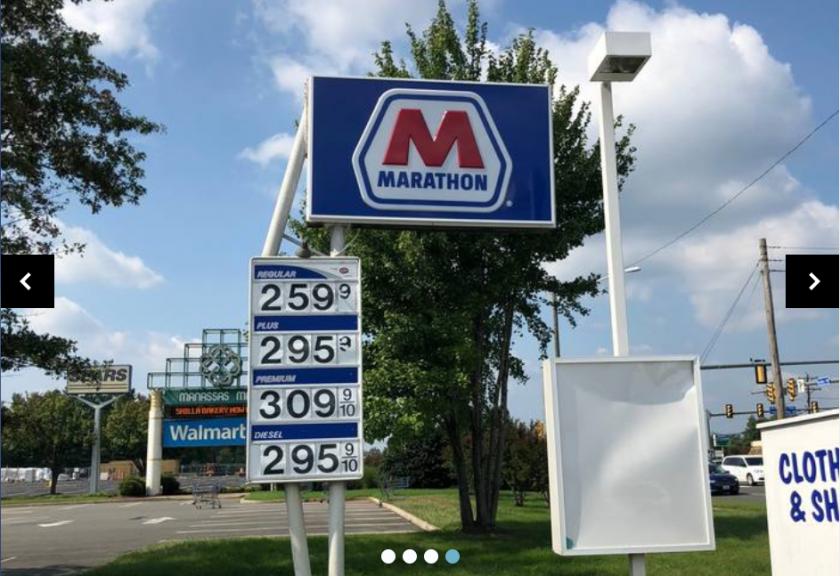
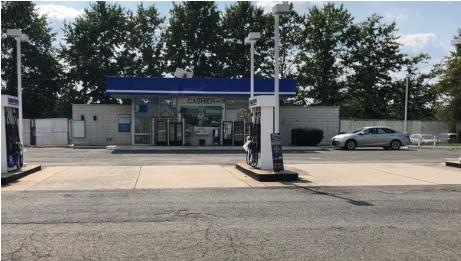
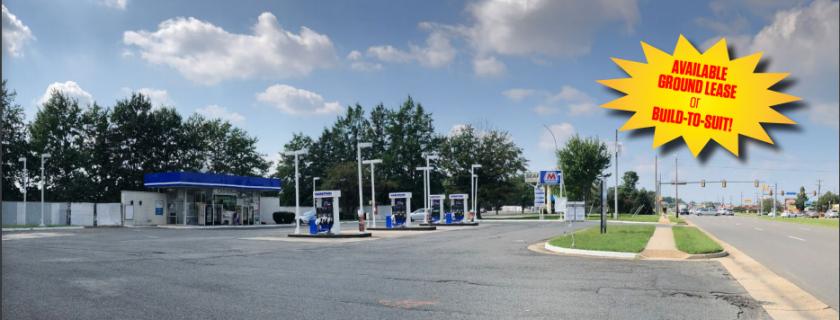
1-Mile | 3-Miles | 5-Miles | ||
---|---|---|---|---|
Total Population | 15,760 | 98,093 | 176,870 | |
Population Median Age | 33 | 33 | 34 | |
Population by Age | 0-9 Yrs | 2604 (16%) | 16905 (17%) | 27747 (15%) |
10-19 Yrs | 2235 (14%) | 12936 (13%) | 25430 (14%) | |
20-29 Yrs | 2594 (16%) | 15514 (15%) | 24809 (14%) | |
30-39 Yrs | 2788 (17%) | 16667 (16%) | 27799 (15%) | |
40-49 Yrs | 2077 (13%) | 13476 (13%) | 26398 (14%) | |
50-59 Yrs | 1623 (10%) | 10887 (11%) | 22433 (12%) | |
60-69 Yrs | 803 (5%) | 6750 (6%) | 13172 (7%) | |
70+ Yrs | 1035 (6%) | 4957 (5%) | 9082 (5%) | |
Median HH Income | $60,826 | $78,002 | $95,862 | |
Total Household Income | < 24K | 766 (16%) | 3418 (11%) | 4871 (9%) |
25-49K | 1275 (26%) | 5337 (18%) | 7445 (14%) | |
50-74K | 860 (18%) | 5104 (17%) | 7868 (14%) | |
75-99K | 589 (12%) | 4529 (15%) | 7350 (13%) | |
100-199K | 985 (20%) | 7964 (27%) | 17401 (33%) | |
200K+ | 268 (5%) | 2455 (8%) | 7702 (14%) | |
Highest Education Level | No Diploma | 2373 | 12667 | 16843 |
Diploma or GED | 3021 | 16537 | 25776 | |
Some College | 1784 | 10939 | 19278 | |
Assoc. Degree | 505 | 4661 | 8417 | |
Bachelors Degree | 1435 | 11105 | 26151 | |
Higher Degree | 651 | 5533 | 15687 | |
Total Housing Units | 5,074 | 30,300 | 55,035 | |
--Owner-Occupied | 2,002 | 16,402 | 34,872 | |
--Renter-Occupied | 2,743 | 12,405 | 17,764 | |
Owner-Occupied Values | < 100K | 12 | 445 | 780 |
100-199K | 362 | 2201 | 2644 | |
200-299K | 667 | 5344 | 7231 | |
300-399K | 788 | 5472 | 10408 | |
400-499K | 127 | 2141 | 7675 | |
500K+ | 45 | 799 | 6134 | |
Total Working Age Population | 11,725 | 73,170 | 133,430 | |
In Work Force | 8,641 | 55,090 | 99,553 | |
Not In Work Force | 3,084 | 18,080 | 33,877 | |
Workforce Employed | 8,337 | 52,387 | 95,180 | |
Workforce Unemployed | 302 | 2,610 | 4,065 | |
Civlian Workforce | 8,638 | 54,997 | 99,245 | |
Military Workforce | 3 | 93 | 308 | |
Total Households | 4,744 | 28,806 | 52,637 | |
Family Households | 3,131 | 21,421 | 40,200 | |
Non-Family Households | 1,613 | 7,385 | 12,437 | |
Married Couple | 2,178 | 15,483 | 31,195 | |
Other Family | 954 | 5,939 | 9,005 | |
Married w/Child | 1,244 | 8,494 | 16,792 | |
Single Male w/Child | 128 | 1,071 | 1,572 | |
Single Female w/Child | 350 | 2,326 | 3,592 |
Population Change Last Two Decades - Plus Projection
2000 | % | 2010 | % | 2020 | % | 2030 | |
---|---|---|---|---|---|---|---|
Virginia | 7,078,515 | +13 | 8,001,024 | +8 | 8,655,021 | +8 | 9,331,666 |
Fairfax County | 969,749 | +12 | 1,081,726 | +7 | 1,162,504 | +7 | 1,244,025 |
Fauquier County | 55,139 | +18 | 65,203 | +9 | 71,395 | +10 | 78,698 |
Loudoun County | 169,599 | +84 | 312,311 | +38 | 430,584 | +29 | 554,808 |
Prince William County | 280,813 | +43 | 402,002 | +19 | 478,134 | +20 | 571,844 |
Manassas city | 35,135 | +8 | 37,821 | +14 | 43,099 | +8 | 46,332 |
Manassas Park city | 10,290 | +39 | 14,273 | +20 | 17,086 | +19 | 20,284 |
Total Working Age Population:
Total Households:
Total Working Age Population:
Total Households:
Total Working Age Population:
Total Households: