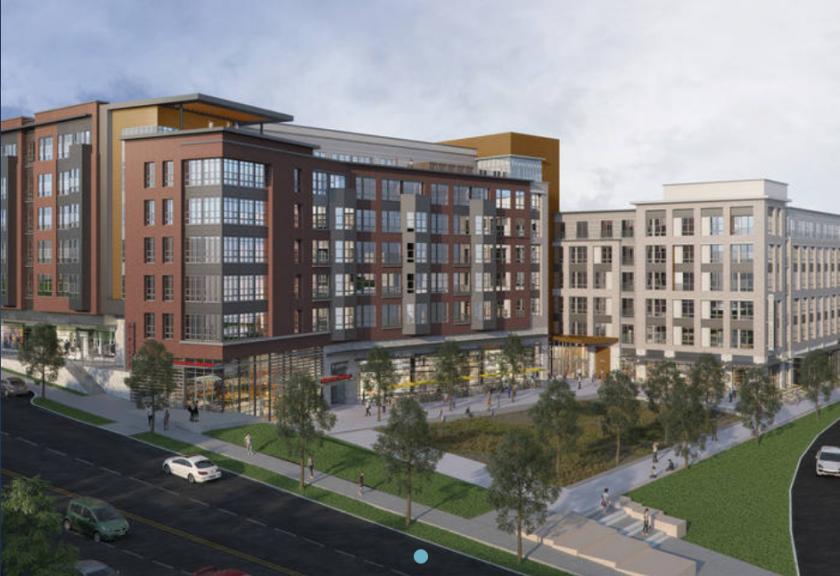
Retail Space
950 South George Mason Drive Arlington, VA 22204
950 South George Mason Drive Arlington, VA 22204
Details & Description
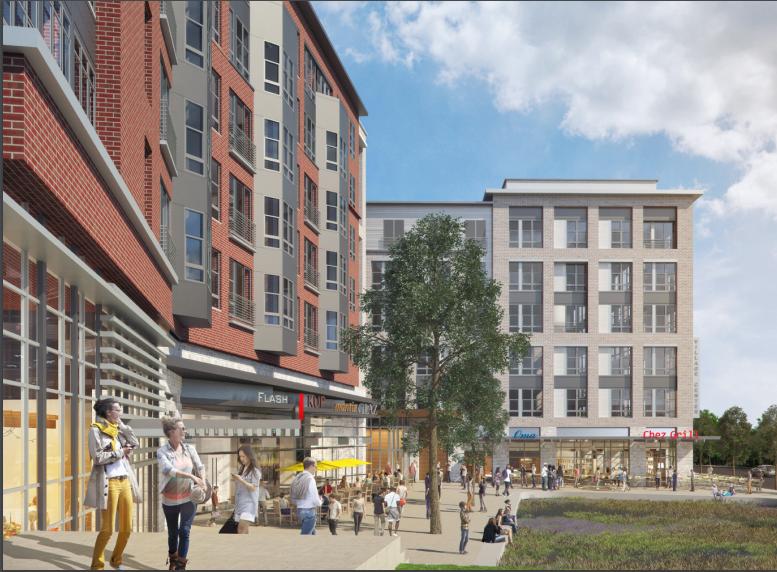
Additional Photos

Listing Agents

Kim Stein
O: 202-652-2338
M: 202-288-1552
kstein@klnb.com
O: 202-652-2338
M: 202-288-1552
kstein@klnb.com

Lindsey Davidson
O: 202-420-7769
M: 239-537-5103
ldavidson@klnb.com
O: 202-420-7769
M: 239-537-5103
ldavidson@klnb.com

Matt Skalet
O: 202-420-7775
M: 202-577-7688
mskalet@klnb.com
O: 202-420-7775
M: 202-577-7688
mskalet@klnb.com
While we strive to provide the most accurate information, all listing information, and demographic data, is provided by third-parties. As such, MyEListing will not be responsible for the accuracy of the information. It is strongly recommended that you verify all information with the listing agent, and any relevant agencies, prior to making any decisions.


