Retail Space
7101 Wisconsin Avenue Bethesda, MD 20814
7101 Wisconsin Avenue Bethesda, MD 20814
Details & Description
Property Highlights
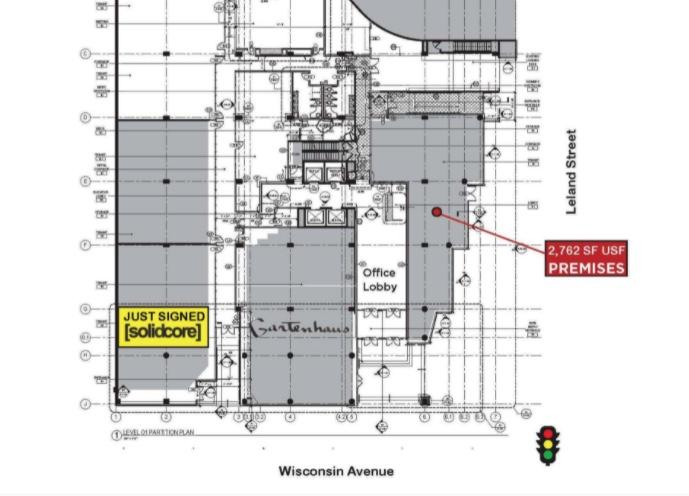
• FedEX Office, Starbucks, Panera, Modells, Solidcore, Orvis, Gartenhaus, True Food Kitchen, Mody Dick, Jos. A. Banks
• Strategically located adjacent to two Montgomery County surface parking lots consisting of 316 parking spaces
Listing Agents

Stephen Combs
O: 202-420-7776
M: 202-255-7100
scombs@klnb.com
O: 202-420-7776
M: 202-255-7100
scombs@klnb.com

Michael Pratt
O: 202-420-7765
M: 202-549-6000
mpratt@klnb.com
O: 202-420-7765
M: 202-549-6000
mpratt@klnb.com
While we strive to provide the most accurate information, all listing information, and demographic data, is provided by third-parties. As such, MyEListing will not be responsible for the accuracy of the information. It is strongly recommended that you verify all information with the listing agent, and any relevant agencies, prior to making any decisions.


