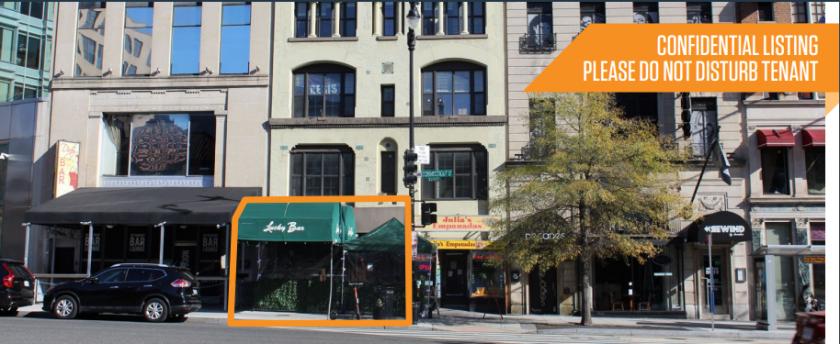
Retail Space
1221 Connecticut Avenue Northwest Washington, DC 20036
1221 Connecticut Avenue Northwest Washington, DC 20036
Details & Description
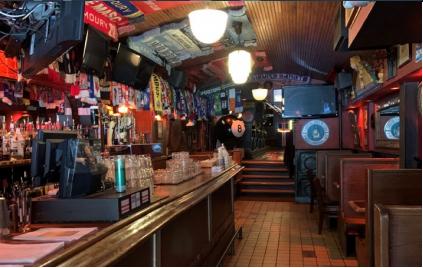
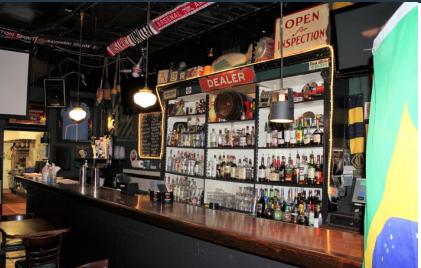
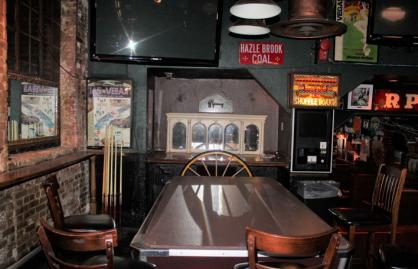
Additional Photos
Listing Agents

Stephen Combs
O: 202-420-7776
M: 202-255-7100
scombs@klnb.com
O: 202-420-7776
M: 202-255-7100
scombs@klnb.com

Kim Stein
O: 202-652-2338
M: 202-288-1552
kstein@klnb.com
O: 202-652-2338
M: 202-288-1552
kstein@klnb.com
While we strive to provide the most accurate information, all listing information, and demographic data, is provided by third-parties. As such, MyEListing will not be responsible for the accuracy of the information. It is strongly recommended that you verify all information with the listing agent, and any relevant agencies, prior to making any decisions.


