Seller financing available with flexible terms
Exceptional signage on well-traveled Aramingo Avenue
Daily traffic count of 28,710
On-site parking for 30± vehicles within a fenced parking lot
Zoning: I-2
Real Estate Taxes: $11,842
Air-conditioned offices that are both open and private. Three (3) AC Units; 2 are 7.5-ton capacity, 1 is 10-ton capacity
Finishes include carpeted and vinyl floor and suspended ceilings
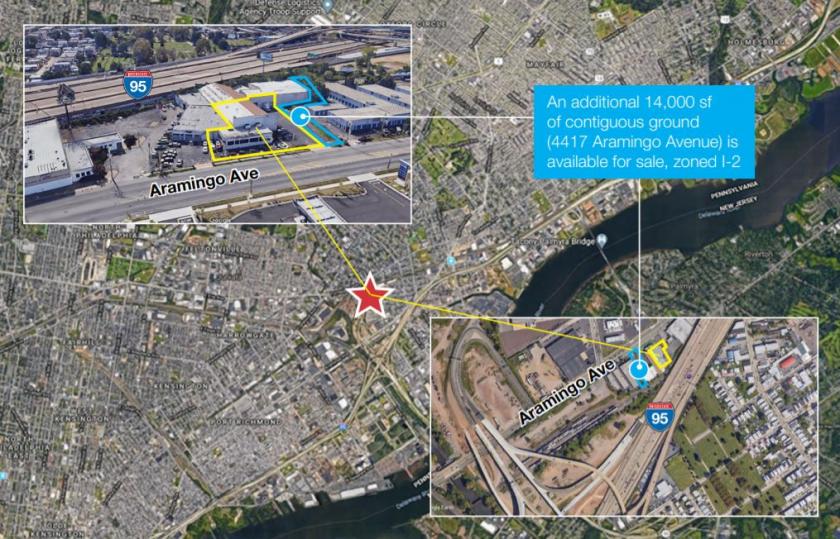
An additional 14,000 sf of contiguous ground (4417 Aramingo Avenue) is available for sale, zoned I-2
LOCATION:
Located ¼ mile North of I-95 Interchange in the heart of the Aramingo Avenue retail corridor and just minutes from Center City, US-1 (Roosevelt Boulevard) and NJ bridges. Steps away from public transportation SEPTA bus Route 25.
Located within approved Qualified Opportunity Zone (QOZ) by PA Department of Community & Economic Development:
https://dced.pa.gov/programs-funding/federal-funding-opportunities/qualified-opportunity-zones/
No part of this information may be copied, reproduced, repurposed, or screen-captured for any commercial purpose without prior written authorization from MyEListing.
While we strive to provide the most accurate information, all listing information, and demographic data, is provided by third-parties. As such, MyEListing will not be responsible for the accuracy of the information. It is strongly recommended that you verify all information with the listing agent, and any relevant agencies, prior to making any decisions.
What is the building size of this Office property in Philadelphia, PA?
The size of the building/unit at 4421 Aramingo Avenue in Philadelphia is 10,900 square feet
How much land does the Philadelphia, PA property at 4421 Aramingo Avenue include?
4421 Aramingo Avenue in Philadelphia includes 0.500 acres of land
What kind of Office is the propery at 4421 Aramingo Avenue?
The property at 4421 Aramingo Avenue Philadelphia, PA 19124 is listed as a Professional Office property
What is the population within 1 mile of 4421 Aramingo Avenue in Philadelphia?
The population within 1 mile of 4421 Aramingo Avenue Philadelphia, PA 19124 is 20,954 people.
Who do I contact for questions about 4421 Aramingo Avenue?
You should contact the listing agent,
Frank Cullen, for any details regarding this commercial listing.