Industrial Properties
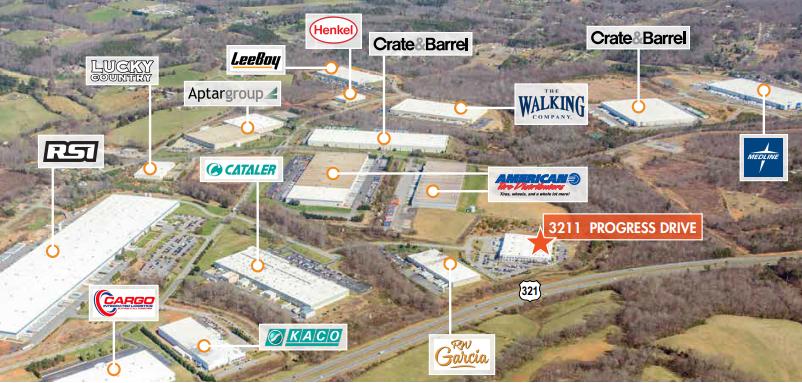
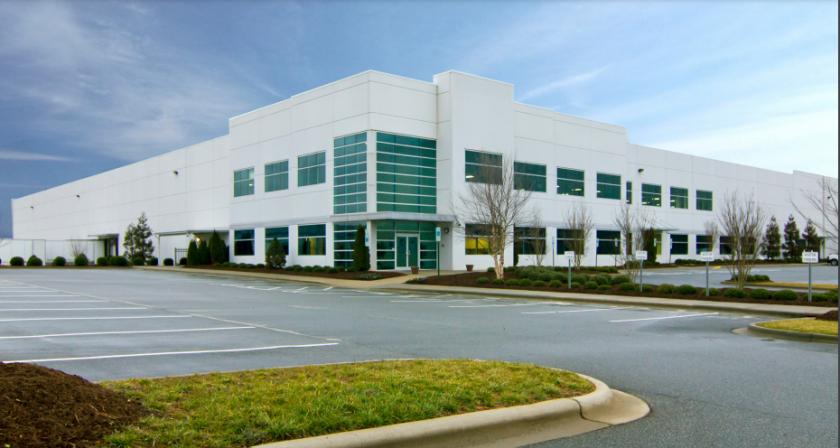
3211 Progress Drive Lincolnton, NC 28092
3211 Progress Drive Lincolnton, NC 28092
Details & Description
Listing Agents

Warren Snowdon
O: 704-705-3852
warren.snowdon@foundrycommercial.com
O: 704-705-3852
warren.snowdon@foundrycommercial.com
While we strive to provide the most accurate information, all listing information, and demographic data, is provided by third-parties. As such, MyEListing will not be responsible for the accuracy of the information. It is strongly recommended that you verify all information with the listing agent, and any relevant agencies, prior to making any decisions.