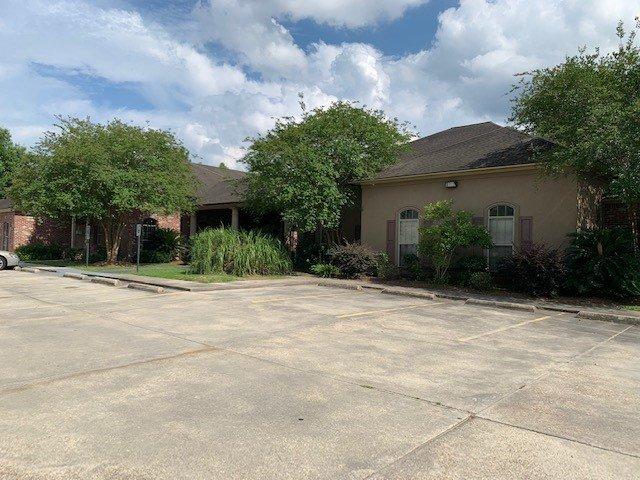
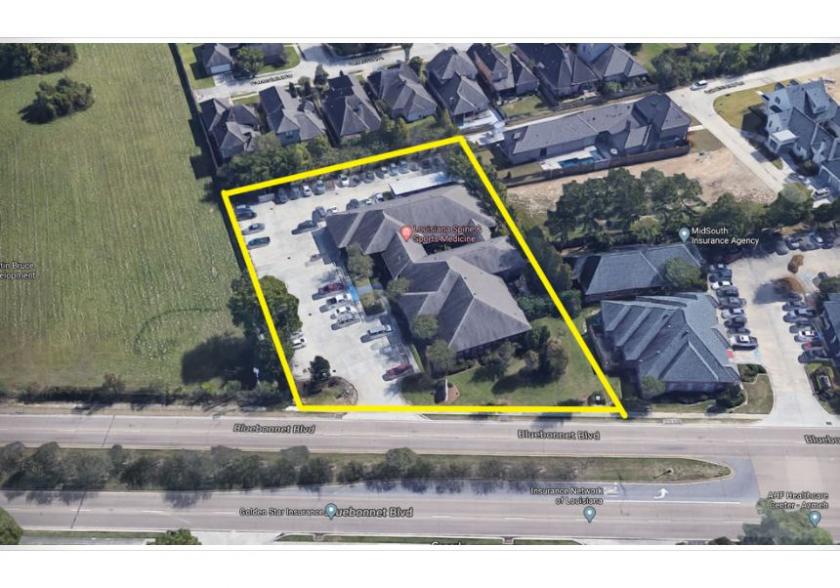
Office consisting of 2 Buildings for Lease (All or Part) on 1.23 acre lot:
• Connected by a nice Courtyard / Breezeway
• Currently being used as a Medical Office
• 216' Frontage
• 478' Depth
• Building A: 7,000 SF (6,000 Downstairs / 1,000 Upstairs)
- 12 Exam Rooms
- 7 Offices
- 2 Nurses Stations
- Business Office
- X-ray Room
- Conference Room
- Reception and Lobby
- 6 Restrooms
- Lounge
- 1,000 SF Finished Space Upstairs can be used as Business Office
• Building B: 6,000 SF
- 16 Exam Rooms
- 3 Offices
- 1 Nurses Stations
- Business Office
- 1 Reception Area
- Lobby
- 4 Restrooms
- Large Physical Therapy / Exercise Area
• $20/PSF, Modified Gross
- Depending on Split
- Tenant responsible for Pro-rata share of Utilities, Janitorial
• Ample Parking; 60 Parking Spaces
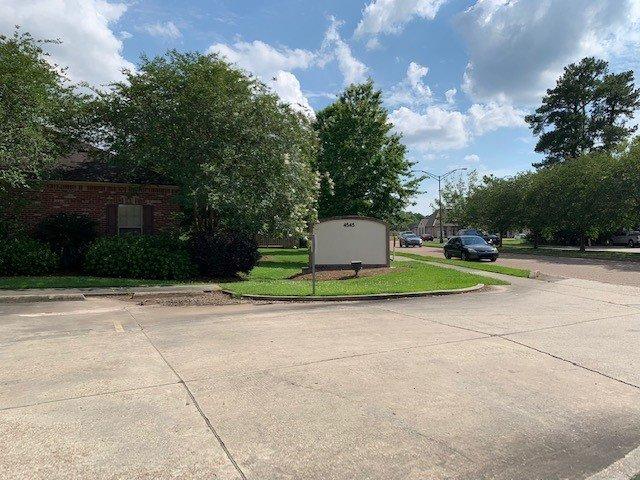
• In highly desirable Bluebonnet corridor between I-10 and Jefferson Hwy.
• Flood Zone "X"
No part of this information may be copied, reproduced, repurposed, or screen-captured for any commercial purpose without prior written authorization from MyEListing.
While we strive to provide the most accurate information, all listing information, and demographic data, is provided by third-parties. As such, MyEListing will not be responsible for the accuracy of the information. It is strongly recommended that you verify all information with the listing agent, and any relevant agencies, prior to making any decisions.
What is the asking price for 4545 Bluebonnet Boulevard in Baton Rouge?
The asking price for 4545 Bluebonnet Boulevard is $20.00 a SF per Year
What is the building size of this commercial Office property?
The size of this multi-unit property varies between 3000 - 12000 square feet
What kind of Office is the propery at 4545 Bluebonnet Boulevard?
The property at 4545 Bluebonnet Boulevard Baton Rouge, LA 70809 is listed as a Medical Office property
What is the population within 1 mile of 4545 Bluebonnet Boulevard in Baton Rouge?
The population within 1 mile of 4545 Bluebonnet Boulevard Baton Rouge, LA 70809 is 8,607 people.
Who do I contact for questions about 4545 Bluebonnet Boulevard?
You should contact the listing agent,
Michael Stinson, for any details regarding this commercial listing.