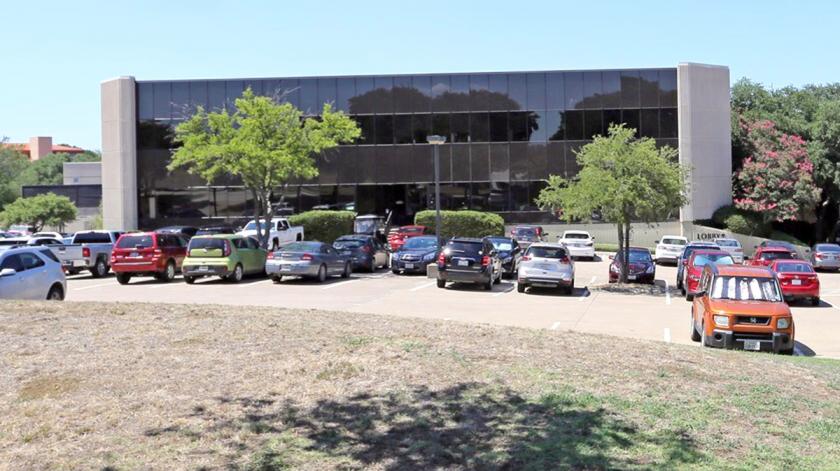
Building Class: Class B Office
Submarket: Urban Center/Wingren
Year Built/Reno: 1980/2007
Parking: 3.48:1,000
Building Features
• Tenant conference room
• Easy access from Northwest Highway and Highways 114, 183 and 161
• Close proximity to restaurants, retail and hotels
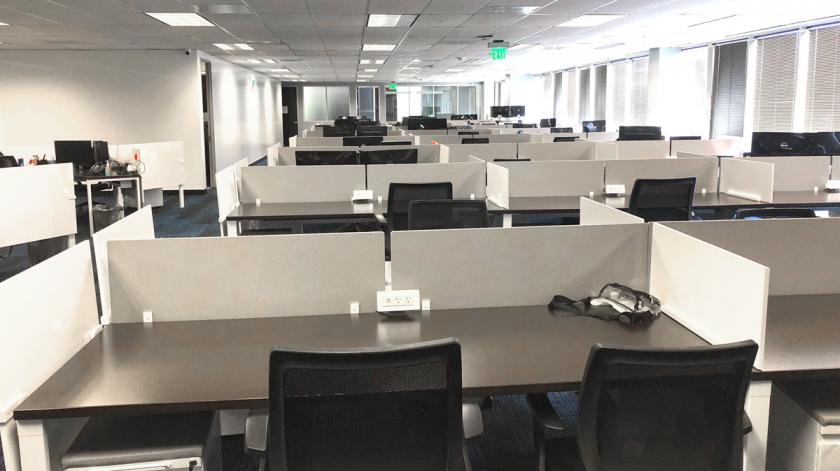
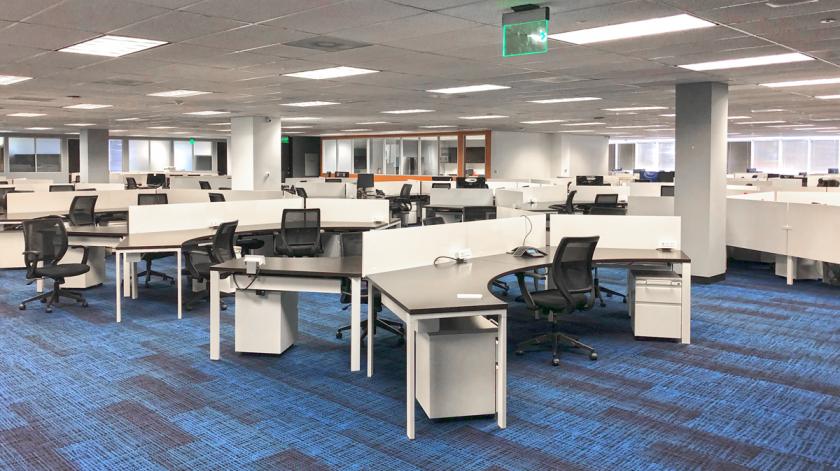
Space Features
• First floor lobby exposure
• Furnished
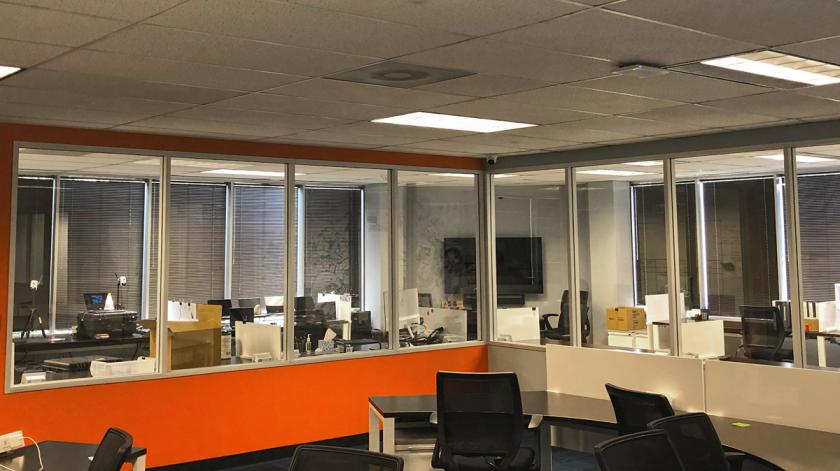
• TVs in break room, IT room and conference rooms (Apple TV/Soundbar/HDMI)
• Conference room with projector and drop-down screen
• White noise
• Security cameras
• Two SS refrigerators
• Secure room
• Secure server room
• Testing room with sink
No part of this information may be copied, reproduced, repurposed, or screen-captured for any commercial purpose without prior written authorization from MyEListing.
While we strive to provide the most accurate information, all listing information, and demographic data, is provided by third-parties. As such, MyEListing will not be responsible for the accuracy of the information. It is strongly recommended that you verify all information with the listing agent, and any relevant agencies, prior to making any decisions.
What is the asking price for 4545 Fuller Drive in Irving?
The asking price for 4545 Fuller Drive is $13.00 a SF per Year
What is the building size of this commercial Office property?
The size of this lease property at '.4545 Fuller Drive.' is 19038 square feet
What kind of Office is the propery at 4545 Fuller Drive?
The property at 4545 Fuller Drive Irving, TX 75038 is listed as a Professional Office property
What is the population within 1 mile of 4545 Fuller Drive in Irving?
The population within 1 mile of 4545 Fuller Drive Irving, TX 75038 is 9,820 people.
Who do I contact for questions about 4545 Fuller Drive?
You should contact the listing agent,
Maschera Usrey, for any details regarding this commercial listing.