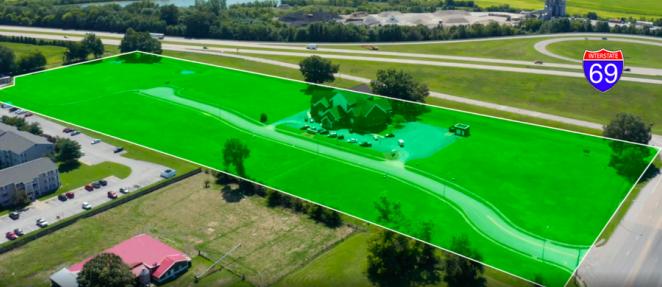
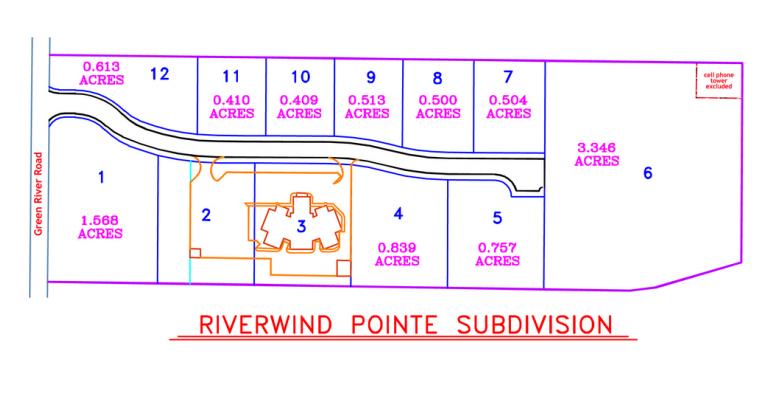
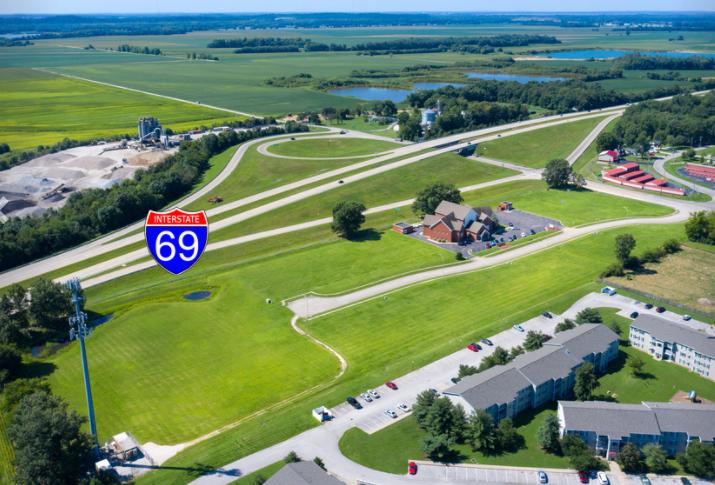
1-Mile | 3-Miles | 5-Miles | ||
---|---|---|---|---|
Total Population | 5,236 | 46,703 | 95,827 | |
Population Median Age | 35 | 39 | 40 | |
Population by Age | 0-9 Yrs | 654 (12%) | 5855 (12%) | 11332 (11%) |
10-19 Yrs | 625 (11%) | 5226 (11%) | 10782 (11%) | |
20-29 Yrs | 1135 (21%) | 6906 (14%) | 14935 (15%) | |
30-39 Yrs | 884 (16%) | 6741 (14%) | 12520 (13%) | |
40-49 Yrs | 574 (10%) | 4873 (10%) | 10810 (11%) | |
50-59 Yrs | 460 (8%) | 5747 (12%) | 12480 (13%) | |
60-69 Yrs | 616 (11%) | 6239 (13%) | 11982 (12%) | |
70+ Yrs | 287 (5%) | 5116 (10%) | 10984 (11%) | |
Median HH Income | $42,068 | $46,213 | $44,372 | |
Total Household Income | < 24K | 697 (29%) | 5061 (24%) | 11017 (26%) |
25-49K | 747 (31%) | 5860 (28%) | 11862 (28%) | |
50-74K | 461 (19%) | 3747 (18%) | 7753 (18%) | |
75-99K | 260 (10%) | 2466 (12%) | 4761 (11%) | |
100-199K | 236 (9%) | 2745 (13%) | 5291 (12%) | |
200K+ | 0 (0%) | 531 (2%) | 1142 (2%) | |
Highest Education Level | No Diploma | 481 | 3574 | 7254 |
Diploma or GED | 1282 | 10236 | 21568 | |
Some College | 691 | 6690 | 14335 | |
Assoc. Degree | 365 | 3096 | 6248 | |
Bachelors Degree | 523 | 5792 | 11331 | |
Higher Degree | 125 | 3071 | 6048 | |
Total Housing Units | 2,665 | 22,294 | 47,200 | |
--Owner-Occupied | 1,228 | 12,325 | 24,409 | |
--Renter-Occupied | 1,173 | 8,086 | 17,416 | |
Owner-Occupied Values | < 100K | 574 | 5010 | 10725 |
100-199K | 603 | 5207 | 9405 | |
200-299K | 49 | 1282 | 2517 | |
300-399K | 1 | 427 | 920 | |
400-499K | 0 | 183 | 389 | |
500K+ | 0 | 216 | 453 | |
Total Working Age Population | 4,215 | 37,436 | 77,840 | |
In Work Force | 2,960 | 23,978 | 48,945 | |
Not In Work Force | 1,255 | 13,457 | 28,894 | |
Workforce Employed | 2,712 | 22,794 | 46,493 | |
Workforce Unemployed | 248 | 1,185 | 2,451 | |
Civlian Workforce | 2,960 | 23,978 | 48,944 | |
Military Workforce | 0 | 0 | 1 | |
Total Households | 2,401 | 20,411 | 41,825 | |
Family Households | 1,273 | 11,569 | 23,109 | |
Non-Family Households | 1,128 | 8,842 | 18,717 | |
Married Couple | 640 | 7,887 | 15,650 | |
Other Family | 633 | 3,682 | 7,458 | |
Married w/Child | 201 | 2,587 | 5,113 | |
Single Male w/Child | 67 | 460 | 892 | |
Single Female w/Child | 312 | 1,783 | 3,358 |
Population Change Last Two Decades - Plus Projection
2000 | % | 2010 | % | 2020 | % | 2030 | |
---|---|---|---|---|---|---|---|
Indiana | 6,080,485 | +7 | 6,483,802 | +4 | 6,738,573 | +4 | 7,014,880 |
Vanderburgh County | 171,922 | +5 | 179,703 | +3 | 184,440 | +3 | 189,441 |
Warrick County | 52,383 | +14 | 59,689 | +7 | 63,818 | +6 | 67,958 |
Kentucky | 4,041,769 | +7 | 4,339,367 | +4 | 4,533,464 | +4 | 4,726,382 |
Daviess County | 91,545 | +6 | 96,656 | +6 | 102,033 | +5 | 106,676 |
Henderson County | 44,829 | +3 | 46,250 | 0 | 46,358 | -2 | 45,516 |
Total Working Age Population:
Total Households:
Total Working Age Population:
Total Households:
Total Working Age Population:
Total Households: