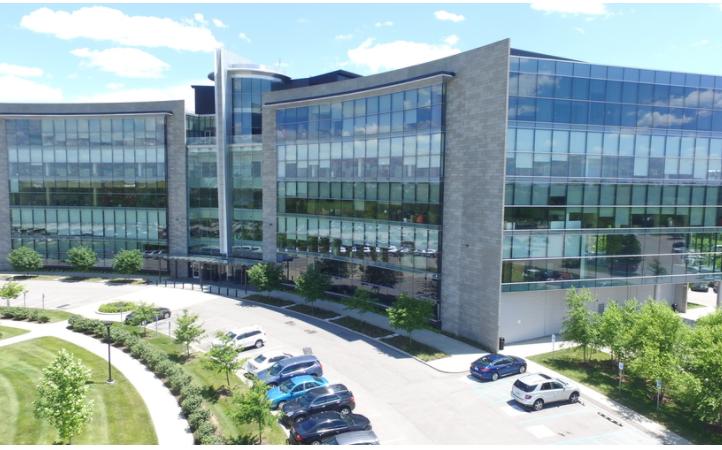
SVN Stone Commercial is proud to present 1648 McGrathiana Parkway for Lease. This class "A" office building is situated on the University of Kentucky Coldstream Research Campus located at Newtown Pike and Interstates I-64/I-75. The subject is zoned "P-2" professional office with research overlay. 1648 McGrathiana Parkway has two vacancies, one on the 1st floor and one on the 3rd floor. Plenty of convenient parking for tenants and customers, property protection key security system providing 24-hour building access, two passenger elevators and one freight elevator, dramatic atrium entrance, and a professional management team are just some of the highlights on this class "A" property.
Highlights
Class "A" Office Building Full Service Leasing
Conveniently Located Near Downtown Lexington and the University of Kentucky
Close Access to Both I-75 and I-64
Located in the University of Kentucky Coldstream Research Campus
Redundant Power - Building is Powered From Two Different Electrical Substations
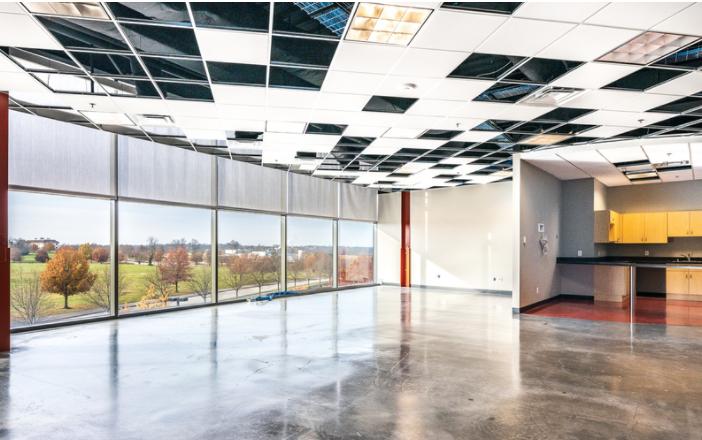
High End Common Area Finishes
Breathtaking Views of the Surrounding Horse Farms
Ample on Site Parking
No part of this information may be copied, reproduced, repurposed, or screen-captured for any commercial purpose without prior written authorization from MyEListing.
While we strive to provide the most accurate information, all listing information, and demographic data, is provided by third-parties. As such, MyEListing will not be responsible for the accuracy of the information. It is strongly recommended that you verify all information with the listing agent, and any relevant agencies, prior to making any decisions.
What is the asking price for 1648 McGrathiana Parkway in Lexington?
The asking price for 1648 McGrathiana Parkway is $19.50 a SF per Year
What is the building size of this commercial Office property?
The size of this multi-unit property varies between 4983 - 5921 square feet
What kind of Office is the propery at 1648 McGrathiana Parkway?
The property at 1648 McGrathiana Parkway Lexington, KY 40511 is listed as a Medical Office property
What is the population within 1 mile of 1648 McGrathiana Parkway in Lexington?
The population within 1 mile of 1648 McGrathiana Parkway Lexington, KY 40511 is 3,493 people.
Who do I contact for questions about 1648 McGrathiana Parkway?
You should contact the listing agent,
John Bunch, for any details regarding this commercial listing.