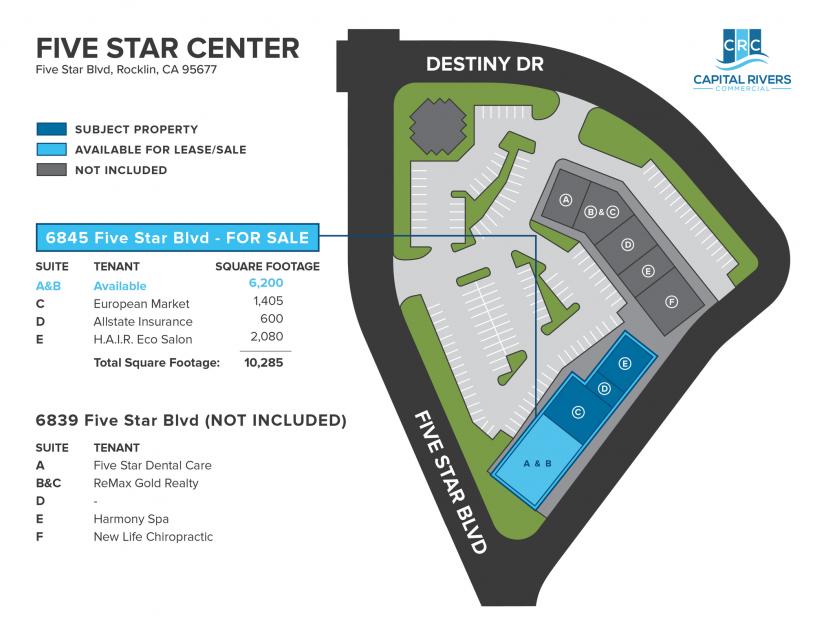
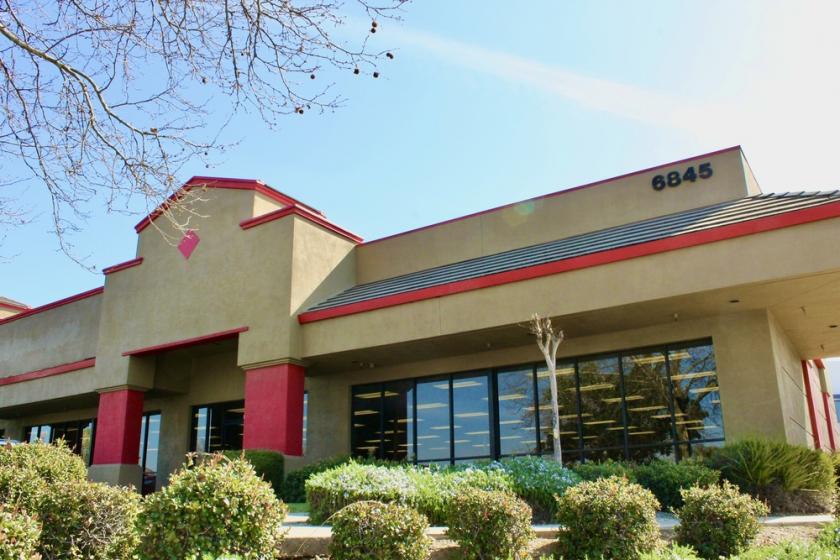
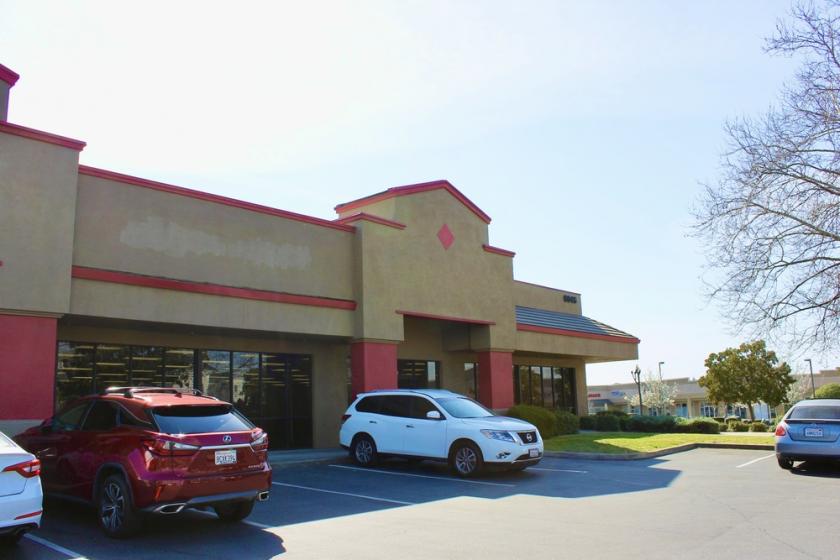
1-Mile | 3-Miles | 5-Miles | ||
---|---|---|---|---|
Total Population | 12,175 | 95,964 | 214,528 | |
Population Median Age | 36 | 38 | 39 | |
Population by Age | 0-9 Yrs | 1607 (13%) | 11589 (12%) | 25305 (11%) |
10-19 Yrs | 1510 (12%) | 13342 (13%) | 30482 (14%) | |
20-29 Yrs | 1856 (15%) | 12747 (13%) | 26261 (12%) | |
30-39 Yrs | 1953 (16%) | 13656 (14%) | 27219 (12%) | |
40-49 Yrs | 1757 (14%) | 13682 (14%) | 29863 (13%) | |
50-59 Yrs | 1560 (12%) | 12433 (12%) | 29237 (13%) | |
60-69 Yrs | 1008 (8%) | 9960 (10%) | 23658 (11%) | |
70+ Yrs | 925 (7%) | 8555 (8%) | 22504 (10%) | |
Median HH Income | $89,073 | $87,035 | $90,868 | |
Total Household Income | < 24K | 560 (12%) | 4450 (12%) | 8868 (11%) |
25-49K | 600 (13%) | 5167 (14%) | 11166 (14%) | |
50-74K | 667 (14%) | 5617 (15%) | 12237 (15%) | |
75-99K | 829 (18%) | 5242 (14%) | 10793 (13%) | |
100-199K | 1549 (33%) | 11077 (31%) | 24901 (31%) | |
200K+ | 383 (8%) | 3962 (11%) | 10280 (13%) | |
Highest Education Level | No Diploma | 384 | 3530 | 7456 |
Diploma or GED | 1422 | 11047 | 24757 | |
Some College | 2126 | 16198 | 36943 | |
Assoc. Degree | 1029 | 7500 | 16549 | |
Bachelors Degree | 2309 | 18047 | 40467 | |
Higher Degree | 904 | 8484 | 19360 | |
Total Housing Units | 4,777 | 37,228 | 81,646 | |
--Owner-Occupied | 2,148 | 20,374 | 52,090 | |
--Renter-Occupied | 2,440 | 15,141 | 26,156 | |
Owner-Occupied Values | < 100K | 59 | 682 | 1617 |
100-199K | 114 | 811 | 1590 | |
200-299K | 342 | 1977 | 5072 | |
300-399K | 617 | 4713 | 12033 | |
400-499K | 467 | 5326 | 12220 | |
500K+ | 549 | 6866 | 19558 | |
Total Working Age Population | 9,680 | 76,156 | 170,873 | |
In Work Force | 6,828 | 50,830 | 109,385 | |
Not In Work Force | 2,851 | 25,326 | 61,488 | |
Workforce Employed | 6,418 | 48,271 | 103,929 | |
Workforce Unemployed | 383 | 2,300 | 5,008 | |
Civlian Workforce | 6,801 | 50,571 | 108,937 | |
Military Workforce | 27 | 259 | 448 | |
Total Households | 4,588 | 35,515 | 78,246 | |
Family Households | 2,995 | 23,956 | 54,618 | |
Non-Family Households | 1,593 | 11,559 | 23,628 | |
Married Couple | 2,187 | 18,631 | 43,184 | |
Other Family | 809 | 5,326 | 11,433 | |
Married w/Child | 1,088 | 9,076 | 19,682 | |
Single Male w/Child | 111 | 810 | 2,011 | |
Single Female w/Child | 257 | 1,880 | 3,593 |
Population Change Last Two Decades - Plus Projection
2000 | % | 2010 | % | 2020 | % | 2030 | |
---|---|---|---|---|---|---|---|
California | 33,871,648 | +10 | 37,253,956 | +9 | 40,467,295 | +8 | 43,631,295 |
Placer County | 248,399 | +40 | 348,432 | +15 | 399,388 | +14 | 456,175 |
Sacramento County | 1,223,499 | +16 | 1,418,788 | +11 | 1,572,195 | +12 | 1,758,565 |
Total Working Age Population:
Total Households:
Total Working Age Population:
Total Households:
Total Working Age Population:
Total Households: