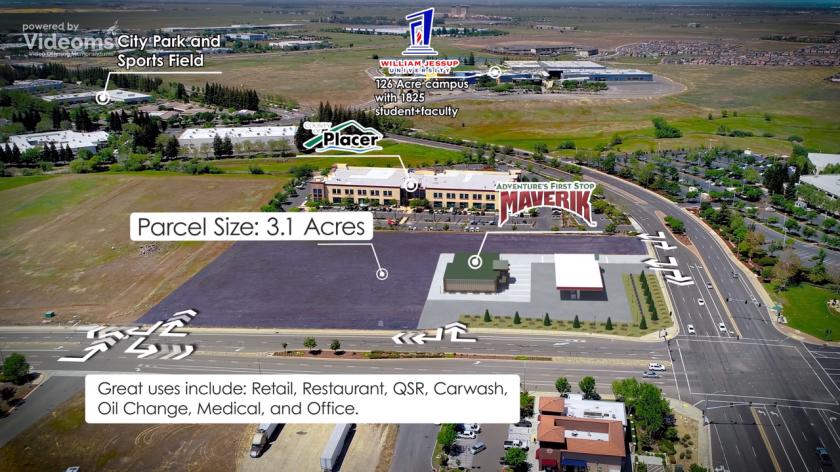
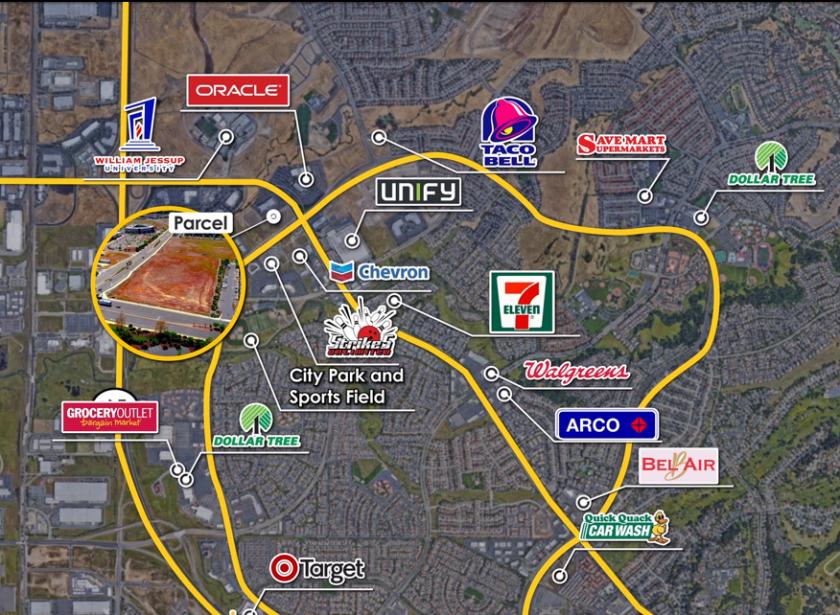
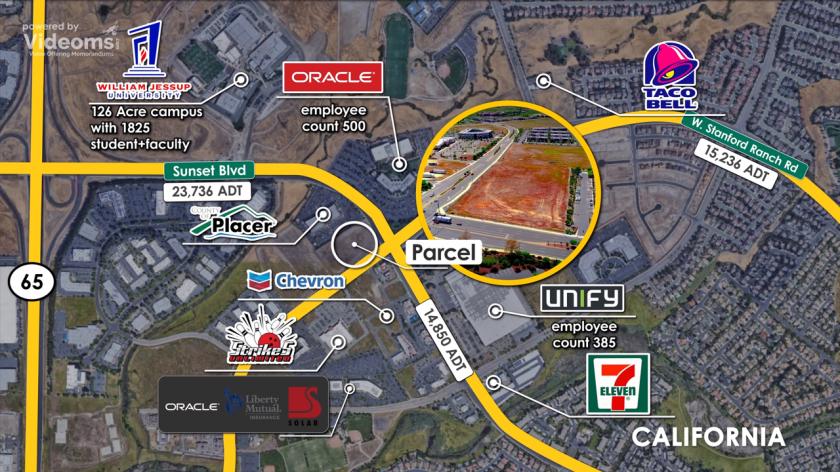
1-Mile | 3-Miles | 5-Miles | ||
---|---|---|---|---|
Total Population | 10,660 | 76,522 | 177,090 | |
Population Median Age | 33 | 37 | 40 | |
Population by Age | 0-9 Yrs | 1718 (16%) | 9993 (13%) | 21259 (12%) |
10-19 Yrs | 2028 (19%) | 12349 (16%) | 25008 (14%) | |
20-29 Yrs | 1179 (11%) | 8800 (11%) | 19800 (11%) | |
30-39 Yrs | 1341 (12%) | 10024 (13%) | 22276 (12%) | |
40-49 Yrs | 1797 (16%) | 12255 (16%) | 24803 (14%) | |
50-59 Yrs | 1320 (12%) | 10072 (13%) | 21931 (12%) | |
60-69 Yrs | 778 (7%) | 6814 (8%) | 19053 (10%) | |
70+ Yrs | 499 (4%) | 6214 (8%) | 22959 (12%) | |
Median HH Income | $116,452 | $108,473 | $94,107 | |
Total Household Income | < 24K | 151 (4%) | 2013 (7%) | 7263 (11%) |
25-49K | 271 (8%) | 2843 (10%) | 8743 (13%) | |
50-74K | 367 (11%) | 3294 (12%) | 9641 (14%) | |
75-99K | 549 (17%) | 3597 (13%) | 8954 (13%) | |
100-199K | 1340 (42%) | 10220 (39%) | 21897 (33%) | |
200K+ | 497 (15%) | 3969 (15%) | 8485 (13%) | |
Highest Education Level | No Diploma | 144 | 1486 | 5062 |
Diploma or GED | 787 | 7101 | 19632 | |
Some College | 1369 | 11566 | 30919 | |
Assoc. Degree | 589 | 5724 | 13268 | |
Bachelors Degree | 2252 | 15750 | 34921 | |
Higher Degree | 1086 | 7951 | 16897 | |
Total Housing Units | 3,255 | 26,733 | 67,530 | |
--Owner-Occupied | 2,258 | 17,711 | 45,367 | |
--Renter-Occupied | 916 | 8,226 | 19,617 | |
Owner-Occupied Values | < 100K | 19 | 127 | 930 |
100-199K | 8 | 321 | 1088 | |
200-299K | 45 | 896 | 2819 | |
300-399K | 203 | 3012 | 9984 | |
400-499K | 771 | 5327 | 12719 | |
500K+ | 1213 | 8028 | 17826 | |
Total Working Age Population | 7,730 | 58,854 | 140,543 | |
In Work Force | 5,388 | 39,550 | 87,161 | |
Not In Work Force | 2,341 | 19,304 | 53,382 | |
Workforce Employed | 5,125 | 37,670 | 82,686 | |
Workforce Unemployed | 224 | 1,579 | 3,877 | |
Civlian Workforce | 5,349 | 39,249 | 86,563 | |
Military Workforce | 39 | 301 | 598 | |
Total Households | 3,174 | 25,937 | 64,984 | |
Family Households | 2,572 | 19,325 | 45,822 | |
Non-Family Households | 602 | 6,612 | 19,162 | |
Married Couple | 2,238 | 15,987 | 37,190 | |
Other Family | 334 | 3,337 | 8,632 | |
Married w/Child | 1,489 | 8,709 | 16,685 | |
Single Male w/Child | 44 | 532 | 1,549 | |
Single Female w/Child | 135 | 1,098 | 2,759 |
Population Change Last Two Decades - Plus Projection
2000 | % | 2010 | % | 2020 | % | 2030 | |
---|---|---|---|---|---|---|---|
California | 33,871,648 | +10 | 37,253,956 | +9 | 40,467,295 | +8 | 43,631,295 |
Placer County | 248,399 | +40 | 348,432 | +15 | 399,388 | +14 | 456,175 |
Total Working Age Population:
Total Households:
Total Working Age Population:
Total Households:
Total Working Age Population:
Total Households: