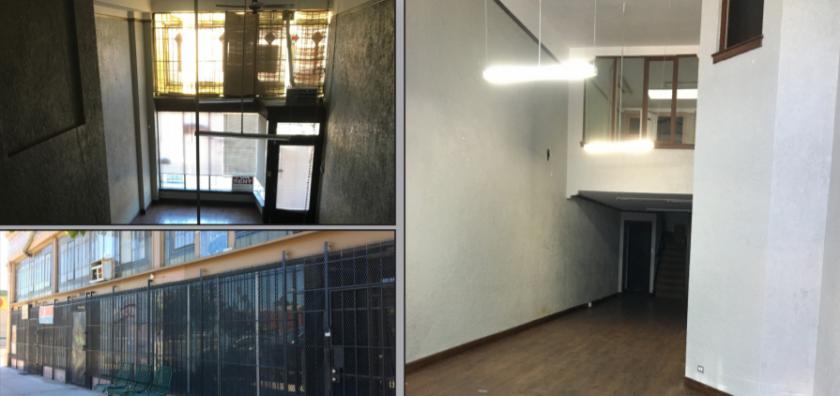
Office Space
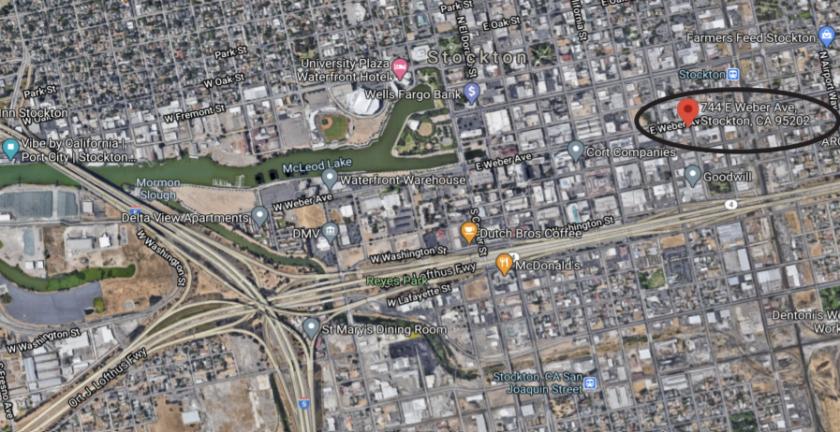
744 East Weber Avenue Stockton, CA 95202
744 East Weber Avenue Stockton, CA 95202
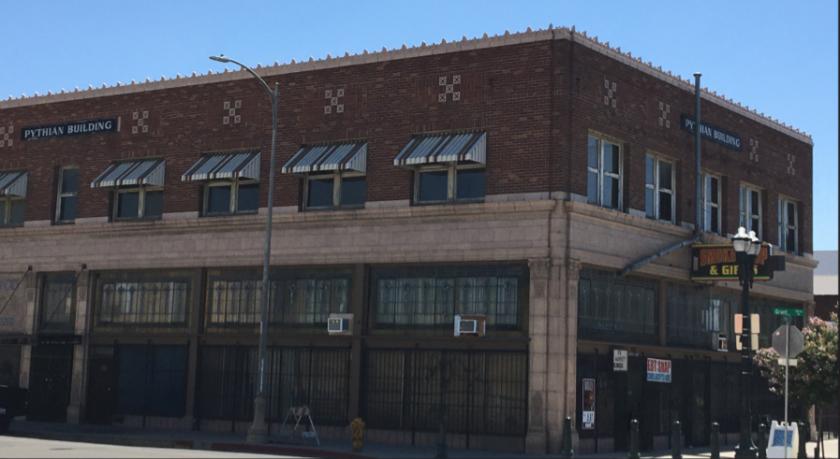
Details & Description
Listing Agents

Mahala Burns
O: 209-235-5231
M: 209-235-5231
mburns@cortco.com
O: 209-235-5231
M: 209-235-5231
mburns@cortco.com
While we strive to provide the most accurate information, all listing information, and demographic data, is provided by third-parties. As such, MyEListing will not be responsible for the accuracy of the information. It is strongly recommended that you verify all information with the listing agent, and any relevant agencies, prior to making any decisions.