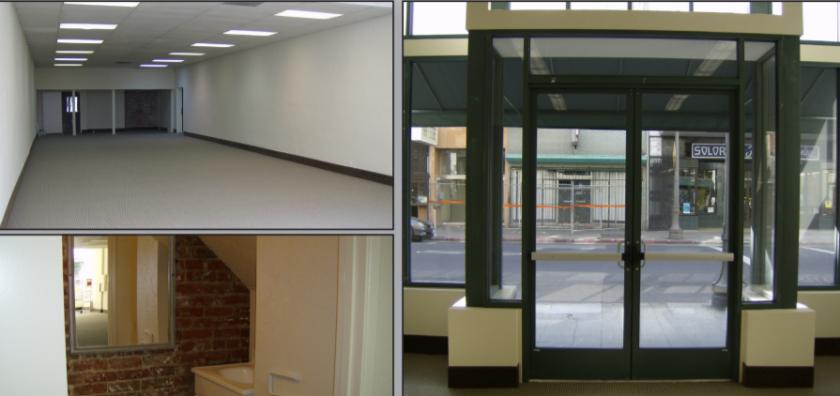
• ±23,000 SF on three floors
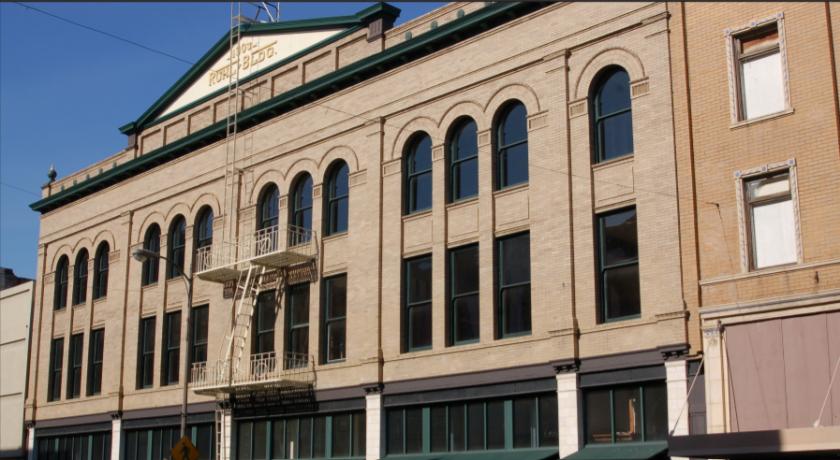
• Updated façade with tiled entries and awnings
• Foam insulated silicone coating roof, 20 yr. warranty
• Low maintenance brick exterior
• Four commercial spaces on the ground floor, nicely renovated & leased
• Two upper floors available to be renovated for residential lofts
• Historic building codes allow enormous construction flexibility and benefit
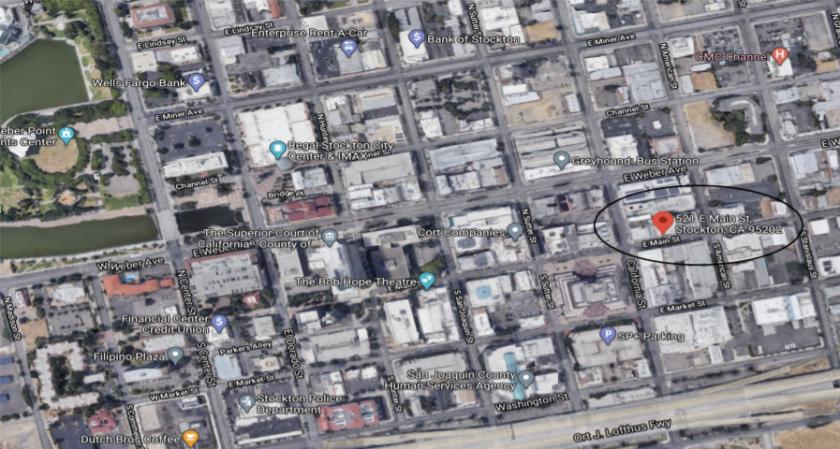
• Zoned Commercial Downtown (CD)
• Neighbors on the block are Trail coffee roastery, CalMain lofts with 30 new loft apartments almost completed, and TEAM Charter School, K-8th grade
• Possible Owner Carry-Back
• Huge potential for growth on this busy block!
No part of this information may be copied, reproduced, repurposed, or screen-captured for any commercial purpose without prior written authorization from MyEListing.
While we strive to provide the most accurate information, all listing information, and demographic data, is provided by third-parties. As such, MyEListing will not be responsible for the accuracy of the information. It is strongly recommended that you verify all information with the listing agent, and any relevant agencies, prior to making any decisions.
What is the asking price for 531 East Main Street in Stockton?
The asking price for 531 East Main Street is $1,500,000
What is the building size of this Retail property in Stockton, CA?
The size of the building/unit at 531 East Main Street in Stockton is 23,000 square feet
How much land does the Stockton, CA property at 531 East Main Street include?
531 East Main Street in Stockton includes 0.230 acres of land
What kind of Retail is the propery at 531 East Main Street?
The property at 531 East Main Street Stockton, CA 95202 is listed as a Other Retail Retail property
What is the population within 1 mile of 531 East Main Street in Stockton?
The population within 1 mile of 531 East Main Street Stockton, CA 95202 is 17,248 people.
Who do I contact for questions about 531 East Main Street?
You should contact the listing agent,
Mahala Burns, for any details regarding this commercial listing.