The vacant spaces in this center are being offered under a modified gross rental setup. The tenants are responsible for paying their own utilities, garbage, and a RE Tax stop. Tenants are responsible for building signage and plyon sign insert.
Highlights
Excellent Visibility on Major East-West Corridor
Less Than One/Half Mile From South Suburban Community College
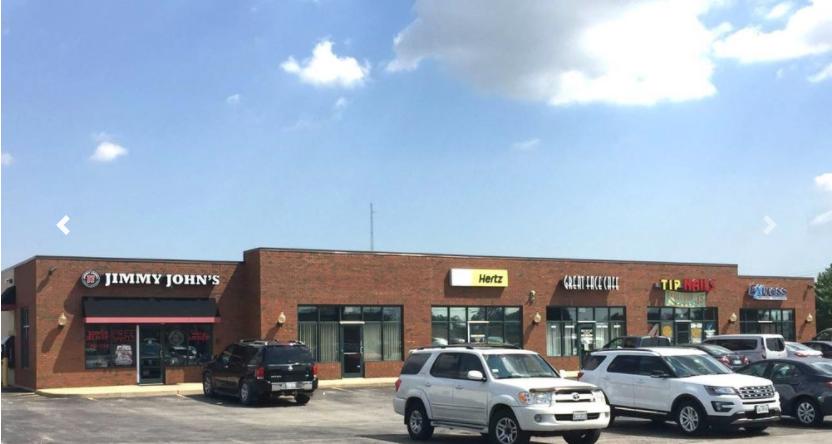
Newer Construction with Attractive Storefront with Brick Face
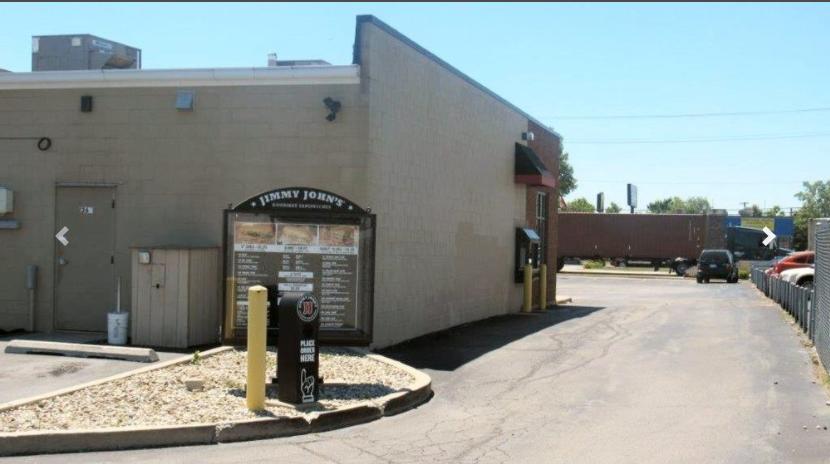
End Cap Offers Drive-Up Window for Jimmy John’s
Special Rear Roll-Up Garage Door Entrance for Hertz
Over-Sized On-Site Parking Lot
Well-Lighted Parking Lot End Cap unit has a drive-up window and exterior order taking equipment
No part of this information may be copied, reproduced, repurposed, or screen-captured for any commercial purpose without prior written authorization from MyEListing.
While we strive to provide the most accurate information, all listing information, and demographic data, is provided by third-parties. As such, MyEListing will not be responsible for the accuracy of the information. It is strongly recommended that you verify all information with the listing agent, and any relevant agencies, prior to making any decisions.
What is the asking price for 250 West 162nd Street in South Holland?
The asking price for 250 West 162nd Street is $26.14 a SF per Year
What is the building size of this commercial Retail property?
The size of this multi-unit property varies between 918 - 2418 square feet
What kind of Retail is the propery at 250 West 162nd Street?
The property at 250 West 162nd Street South Holland, IL 60473 is listed as a Shopping Center Retail property
What is the population within 1 mile of 250 West 162nd Street in South Holland?
The population within 1 mile of 250 West 162nd Street South Holland, IL 60473 is 9,096 people.
Who do I contact for questions about 250 West 162nd Street?
You should contact the listing agent,
Nicholas Manganais, for any details regarding this commercial listing.