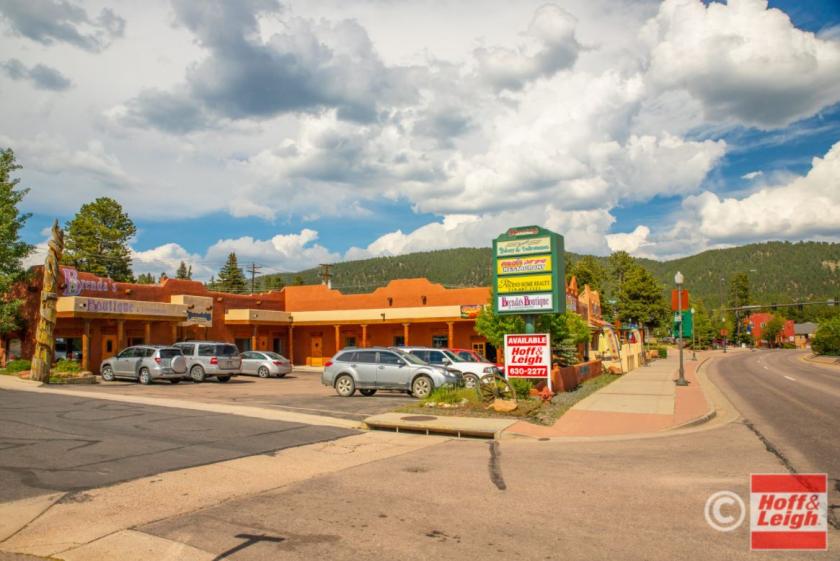
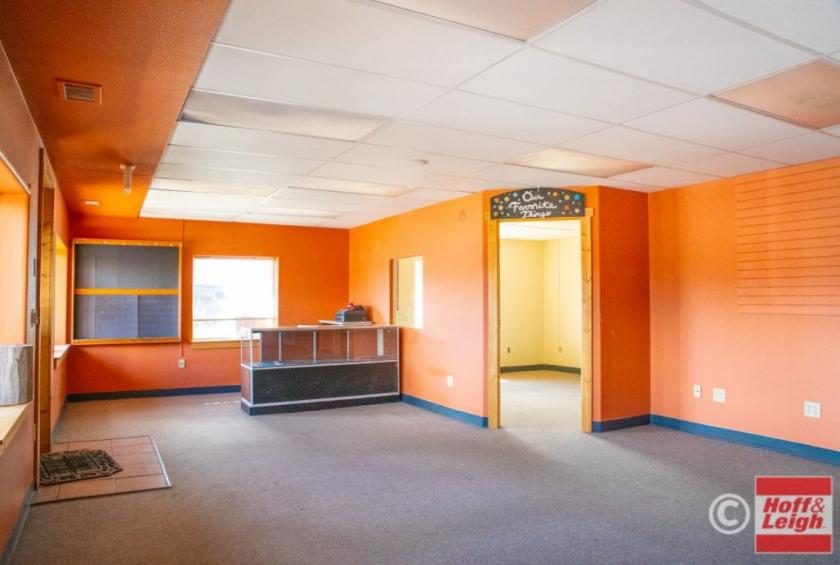
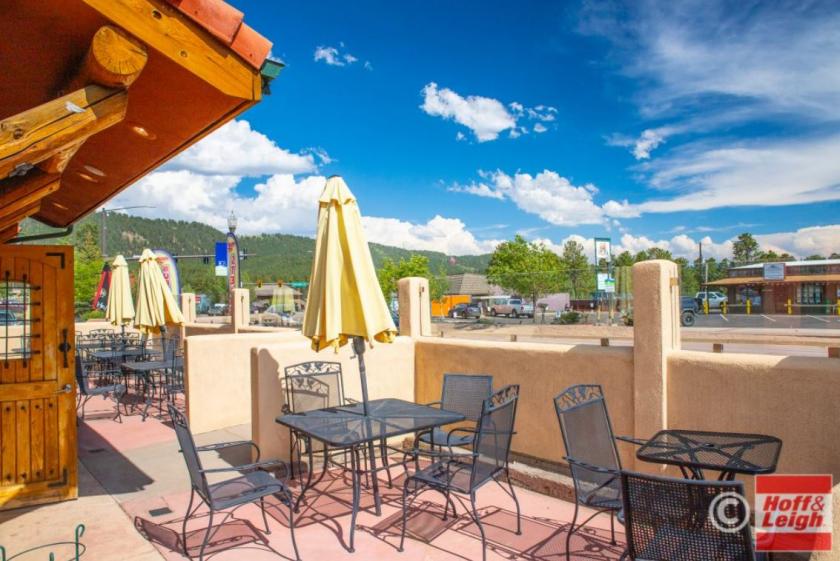
1-Mile | 3-Miles | 5-Miles | ||
---|---|---|---|---|
Total Population | 3,012 | 9,606 | 13,564 | |
Population Median Age | 43 | 43 | 43 | |
Population by Age | 0-9 Yrs | 248 (8%) | 918 (9%) | 1382 (10%) |
10-19 Yrs | 419 (13%) | 1229 (12%) | 1594 (11%) | |
20-29 Yrs | 307 (10%) | 907 (9%) | 1298 (9%) | |
30-39 Yrs | 348 (11%) | 1179 (12%) | 1784 (13%) | |
40-49 Yrs | 378 (12%) | 1055 (10%) | 1489 (10%) | |
50-59 Yrs | 456 (15%) | 1587 (16%) | 2174 (16%) | |
60-69 Yrs | 537 (17%) | 1664 (17%) | 2310 (17%) | |
70+ Yrs | 319 (10%) | 1068 (11%) | 1533 (11%) | |
Median HH Income | $69,050 | $75,237 | $76,100 | |
Total Household Income | < 24K | 142 (11%) | 439 (11%) | 637 (11%) |
25-49K | 316 (24%) | 859 (21%) | 1115 (20%) | |
50-74K | 225 (17%) | 652 (16%) | 939 (17%) | |
75-99K | 168 (13%) | 517 (13%) | 699 (12%) | |
100-199K | 370 (29%) | 1136 (29%) | 1625 (29%) | |
200K+ | 50 (3%) | 306 (7%) | 428 (7%) | |
Highest Education Level | No Diploma | 64 | 167 | 238 |
Diploma or GED | 398 | 1145 | 1719 | |
Some College | 440 | 1596 | 2374 | |
Assoc. Degree | 362 | 999 | 1380 | |
Bachelors Degree | 554 | 1775 | 2496 | |
Higher Degree | 361 | 1307 | 1739 | |
Total Housing Units | 1,438 | 4,337 | 6,217 | |
--Owner-Occupied | 1,018 | 3,068 | 4,386 | |
--Renter-Occupied | 253 | 841 | 1,056 | |
Owner-Occupied Values | < 100K | 45 | 111 | 152 |
100-199K | 131 | 323 | 528 | |
200-299K | 406 | 843 | 1161 | |
300-399K | 285 | 1018 | 1392 | |
400-499K | 60 | 356 | 529 | |
500K+ | 92 | 417 | 624 | |
Total Working Age Population | 2,504 | 7,955 | 11,220 | |
In Work Force | 1,668 | 5,218 | 7,340 | |
Not In Work Force | 836 | 2,737 | 3,880 | |
Workforce Employed | 1,570 | 4,926 | 6,956 | |
Workforce Unemployed | 92 | 275 | 364 | |
Civlian Workforce | 1,661 | 5,201 | 7,321 | |
Military Workforce | 6 | 17 | 20 | |
Total Households | 1,271 | 3,909 | 5,443 | |
Family Households | 904 | 2,829 | 3,908 | |
Non-Family Households | 367 | 1,080 | 1,535 | |
Married Couple | 746 | 2,396 | 3,305 | |
Other Family | 159 | 433 | 603 | |
Married w/Child | 212 | 655 | 889 | |
Single Male w/Child | 26 | 50 | 77 | |
Single Female w/Child | 62 | 175 | 226 |
Population Change Last Two Decades - Plus Projection
2000 | % | 2010 | % | 2020 | % | 2030 | |
---|---|---|---|---|---|---|---|
Colorado | 4,301,261 | +17 | 5,029,196 | +16 | 5,838,181 | +15 | 6,733,658 |
El Paso County | 516,929 | +20 | 622,263 | +18 | 735,176 | +16 | 855,206 |
Teller County | 20,555 | +14 | 23,350 | +10 | 25,630 | +11 | 28,548 |
Total Working Age Population:
Total Households:
Total Working Age Population:
Total Households:
Total Working Age Population:
Total Households: