Excellent owner/user or investment opportunity.
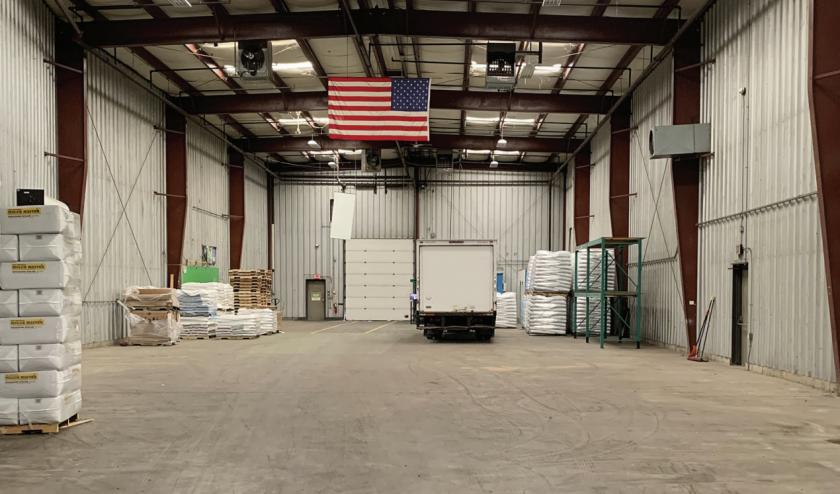
• 7,954 SF w/ 25’ ceiling height and three overhead
doors (10’, 14’ & 16’) on ±.47 acres.
• Zone: MG, Heavy Industrial. Ideal for contractors,
warehouse, storage, fitness & more.
• Electric: 400 amps, 3 phase.
• Fully-sprinkled.
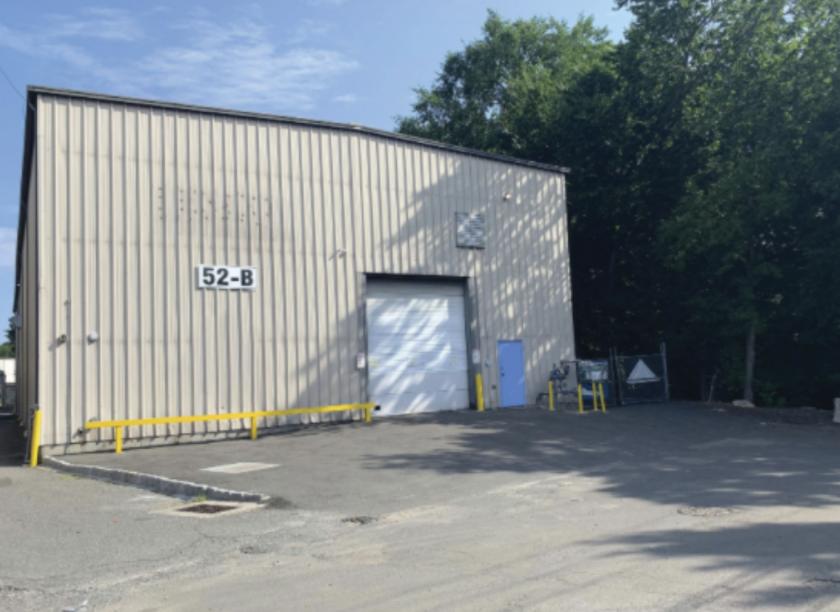
• Direct access from Poplar Street & Viaduct Road.
• Easy access from I-95, Merritt Parkway & Route 1.
• Minutes from Darien & New Canaan.
No part of this information may be copied, reproduced, repurposed, or screen-captured for any commercial purpose without prior written authorization from MyEListing.
While we strive to provide the most accurate information, all listing information, and demographic data, is provided by third-parties. As such, MyEListing will not be responsible for the accuracy of the information. It is strongly recommended that you verify all information with the listing agent, and any relevant agencies, prior to making any decisions.
What is the building size of this Industrial property in Stamford, CT?
The size of the building/unit at 52B Poplar Street in Stamford is 7,954 square feet
How much land does the Stamford, CT property at 52B Poplar Street include?
52B Poplar Street in Stamford includes 0.470 acres of land
What kind of Industrial is the propery at 52B Poplar Street?
The property at 52B Poplar Street Stamford, CT 06907 is listed as a Warehouse Industrial property
What is the population within 1 mile of 52B Poplar Street in Stamford?
The population within 1 mile of 52B Poplar Street Stamford, CT 06907 is 17,436 people.
Who do I contact for questions about 52B Poplar Street?
You should contact the listing agent,
Greg Romano, for any details regarding this commercial listing.