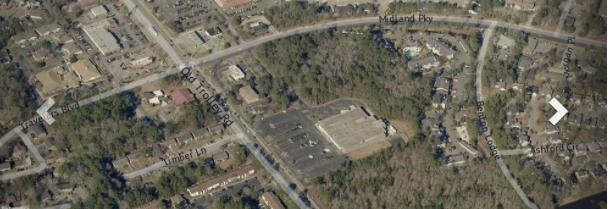
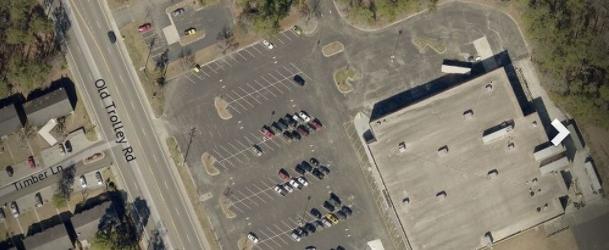
1-Mile | 3-Miles | 5-Miles | ||
---|---|---|---|---|
Total Population | 10,156 | 63,106 | 124,907 | |
Population Median Age | 38 | 37 | 37 | |
Population by Age | 0-9 Yrs | 1362 (13%) | 8763 (13%) | 17052 (13%) |
10-19 Yrs | 1420 (13%) | 8842 (14%) | 17461 (13%) | |
20-29 Yrs | 1344 (13%) | 8050 (12%) | 16368 (13%) | |
30-39 Yrs | 1264 (12%) | 9349 (14%) | 18231 (14%) | |
40-49 Yrs | 1409 (13%) | 8812 (13%) | 16758 (13%) | |
50-59 Yrs | 1332 (13%) | 7730 (12%) | 16181 (12%) | |
60-69 Yrs | 1018 (10%) | 6338 (10%) | 12918 (10%) | |
70+ Yrs | 1008 (9%) | 5222 (8%) | 9937 (7%) | |
Median HH Income | $57,686 | $67,728 | $64,236 | |
Total Household Income | < 24K | 642 (17%) | 3028 (13%) | 7618 (16%) |
25-49K | 904 (24%) | 4434 (19%) | 9402 (20%) | |
50-74K | 823 (22%) | 4991 (22%) | 9190 (20%) | |
75-99K | 597 (15%) | 4135 (18%) | 7075 (15%) | |
100-199K | 647 (17%) | 4694 (21%) | 9648 (21%) | |
200K+ | 125 (3%) | 929 (4%) | 2030 (4%) | |
Highest Education Level | No Diploma | 900 | 3243 | 7563 |
Diploma or GED | 1844 | 10965 | 22332 | |
Some College | 1619 | 10819 | 19943 | |
Assoc. Degree | 735 | 4994 | 9683 | |
Bachelors Degree | 1101 | 8150 | 15965 | |
Higher Degree | 560 | 3823 | 7650 | |
Total Housing Units | 4,261 | 24,012 | 48,338 | |
--Owner-Occupied | 2,189 | 15,005 | 30,319 | |
--Renter-Occupied | 1,548 | 7,205 | 14,642 | |
Owner-Occupied Values | < 100K | 267 | 1386 | 3133 |
100-199K | 923 | 6265 | 12420 | |
200-299K | 777 | 5239 | 9375 | |
300-399K | 161 | 1529 | 3317 | |
400-499K | 30 | 341 | 1119 | |
500K+ | 31 | 246 | 956 | |
Total Working Age Population | 7,968 | 49,180 | 97,555 | |
In Work Force | 5,138 | 33,371 | 65,136 | |
Not In Work Force | 2,830 | 15,809 | 32,419 | |
Workforce Employed | 4,825 | 31,246 | 60,702 | |
Workforce Unemployed | 202 | 1,554 | 3,197 | |
Civlian Workforce | 5,027 | 32,800 | 63,899 | |
Military Workforce | 111 | 570 | 1,237 | |
Total Households | 3,737 | 22,210 | 44,961 | |
Family Households | 2,450 | 15,271 | 30,619 | |
Non-Family Households | 1,287 | 6,940 | 14,343 | |
Married Couple | 1,609 | 11,555 | 22,167 | |
Other Family | 841 | 3,716 | 8,452 | |
Married w/Child | 663 | 4,988 | 9,165 | |
Single Male w/Child | 102 | 340 | 748 | |
Single Female w/Child | 352 | 1,683 | 3,841 |
Population Change Last Two Decades - Plus Projection
2000 | % | 2010 | % | 2020 | % | 2030 | |
---|---|---|---|---|---|---|---|
South Carolina | 4,012,012 | +15 | 4,625,364 | +9 | 5,020,400 | +9 | 5,488,460 |
Berkeley County | 142,651 | +25 | 177,843 | +8 | 192,450 | +11 | 214,140 |
Charleston County | 309,969 | +13 | 350,209 | +5 | 366,380 | +6 | 386,660 |
Colleton County | 38,264 | +2 | 38,892 | +11 | 43,080 | +7 | 46,250 |
Dorchester County | 96,413 | +42 | 136,555 | +9 | 149,300 | +14 | 170,210 |
Total Working Age Population:
Total Households:
Total Working Age Population:
Total Households:
Total Working Age Population:
Total Households: