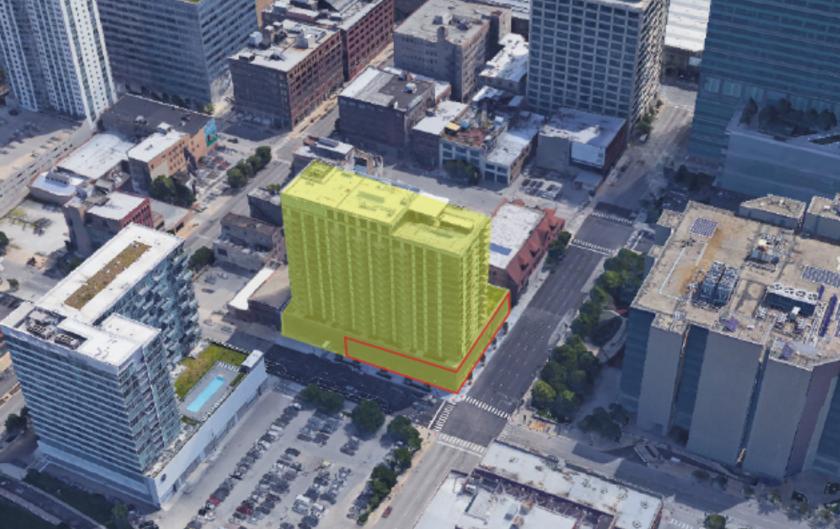
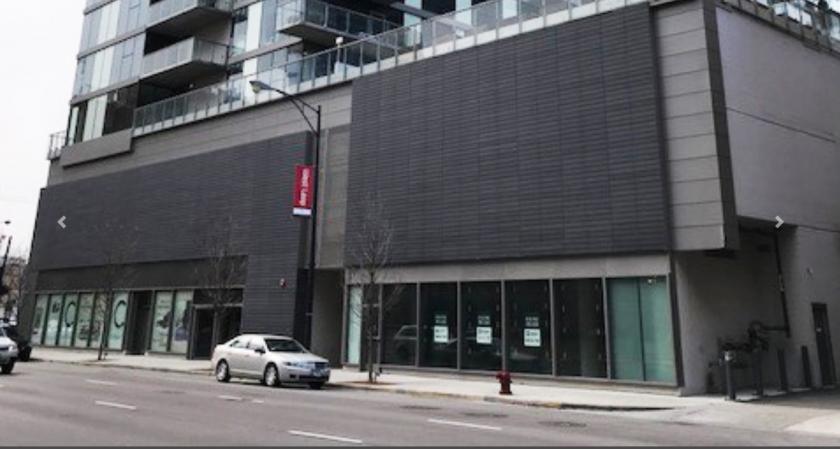
1,294 SF retail space at the base of a 220-unit residential tower
Tremendous density in the West Loop with over 61,000 residents within one mile with an average income of $142,370
Over 45 million SF of office space within 1/2 mile radius
Walking distance to the Hampton Inn and Homewood Suites Hotels totaling 336 keys and directly across from the proposed 47 story high rise tower with 413 residential units
All information based on the most recently available data (updated annually) and is provided in 1-mile, 3-mile, and 5-mile radii (radiuses) of the property location.
1-Mile | 3-Miles | 5-Miles | ||
---|---|---|---|---|
Total Population | 63,151 | 446,103 | 960,340 | |
Population Median Age | 34 | 37 | 36 | |
Population by Age | 0-9 Yrs | 4087 (6%) | 34064 (7%) | 95691 (9%) |
10-19 Yrs | 3714 (5%) | 30389 (6%) | 83059 (8%) | |
20-29 Yrs | 18075 (28%) | 110605 (24%) | 227012 (23%) | |
30-39 Yrs | 18751 (29%) | 104856 (23%) | 203103 (21%) | |
40-49 Yrs | 8155 (12%) | 50198 (11%) | 111676 (11%) | |
50-59 Yrs | 5361 (8%) | 45080 (10%) | 95504 (9%) | |
60-69 Yrs | 3553 (5%) | 40644 (9%) | 80633 (8%) | |
70+ Yrs | 1455 (2%) | 30267 (6%) | 63663 (6%) | |
Median HH Income | $124,035 | $102,572 | $81,382 | |
Total Household Income | < 24K | 3435 (9%) | 34804 (15%) | 84068 (19%) |
25-49K | 2474 (7%) | 22896 (10%) | 61869 (14%) | |
50-74K | 3361 (9%) | 26759 (11%) | 57873 (13%) | |
75-99K | 4452 (12%) | 25618 (11%) | 48616 (11%) | |
100-199K | 11919 (34%) | 66646 (29%) | 109386 (25%) | |
200K+ | 9120 (26%) | 48016 (21%) | 70633 (16%) | |
Highest Education Level | No Diploma | 926 | 21769 | 77906 |
Diploma or GED | 2311 | 29956 | 97250 | |
Some College | 2885 | 34636 | 83613 | |
Assoc. Degree | 1088 | 10560 | 27427 | |
Bachelors Degree | 23381 | 131264 | 229362 | |
Higher Degree | 19547 | 117296 | 183297 | |
Total Housing Units | 39,850 | 256,458 | 490,994 | |
--Owner-Occupied | 14,034 | 92,451 | 168,724 | |
--Renter-Occupied | 20,727 | 132,288 | 263,721 | |
Owner-Occupied Values | < 100K | 181 | 2000 | 6469 |
100-199K | 213 | 4768 | 19475 | |
200-299K | 2762 | 15011 | 30568 | |
300-399K | 3528 | 17071 | 28754 | |
400-499K | 2894 | 14499 | 23446 | |
500K+ | 4456 | 39101 | 60012 | |
Total Working Age Population | 58,279 | 397,856 | 817,471 | |
In Work Force | 47,649 | 297,477 | 588,357 | |
Not In Work Force | 10,630 | 100,379 | 229,114 | |
Workforce Employed | 45,924 | 285,728 | 557,584 | |
Workforce Unemployed | 1,670 | 11,510 | 30,451 | |
Civlian Workforce | 47,594 | 297,238 | 588,034 | |
Military Workforce | 55 | 240 | 323 | |
Total Households | 34,761 | 224,738 | 432,445 | |
Family Households | 11,343 | 87,055 | 186,589 | |
Non-Family Households | 23,418 | 137,683 | 245,856 | |
Married Couple | 9,970 | 67,980 | 128,827 | |
Other Family | 1,374 | 19,075 | 57,762 | |
Married w/Child | 2,683 | 19,956 | 46,181 | |
Single Male w/Child | 145 | 1,768 | 4,896 | |
Single Female w/Child | 516 | 6,251 | 21,854 |
Population Change Last Two Decades - Plus Projection
2000 | % | 2010 | % | 2020 | % | 2030 | |
---|---|---|---|---|---|---|---|
Illinois | 12,419,293 | +3 | 12,830,632 | +12 | 14,316,487 | +6 | 15,138,849 |
Cook County | 5,376,741 | -3 | 5,194,675 | +10 | 5,707,832 | +5 | 5,990,243 |
No part of this information may be copied, reproduced, repurposed, or screen-captured for any commercial purpose without prior written authorization from MyEListing.
While we strive to provide the most accurate information, all listing information, and demographic data, is provided by third-parties. As such, MyEListing will not be responsible for the accuracy of the information. It is strongly recommended that you verify all information with the listing agent, and any relevant agencies, prior to making any decisions.