Retail Space
7111 East Mayo Boulevard Phoenix, AZ 85054
7111 East Mayo Boulevard Phoenix, AZ 85054
Details & Description
Property Highlights
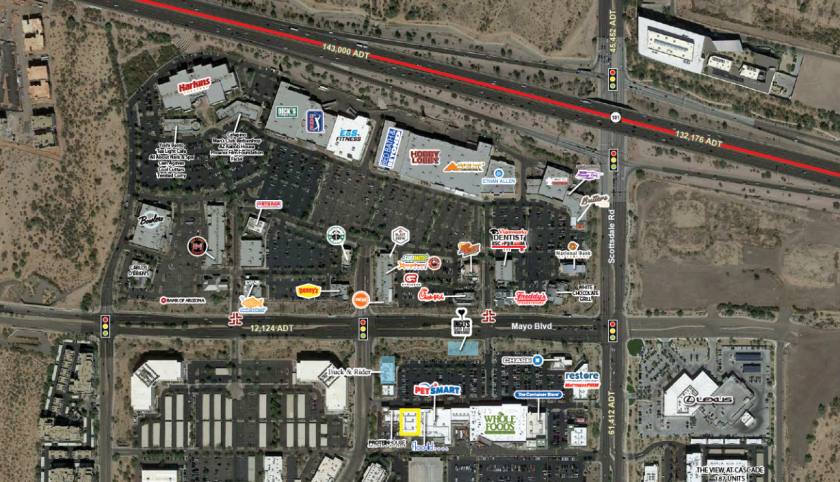
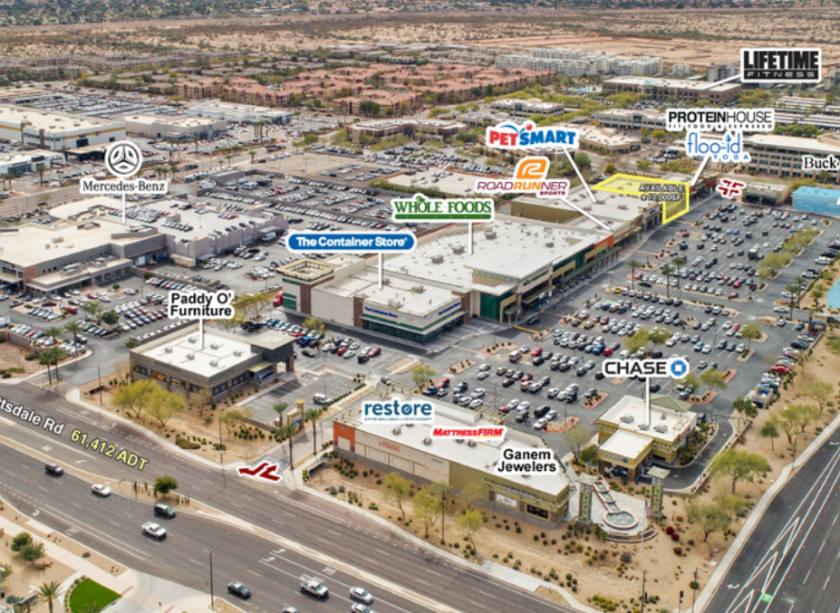
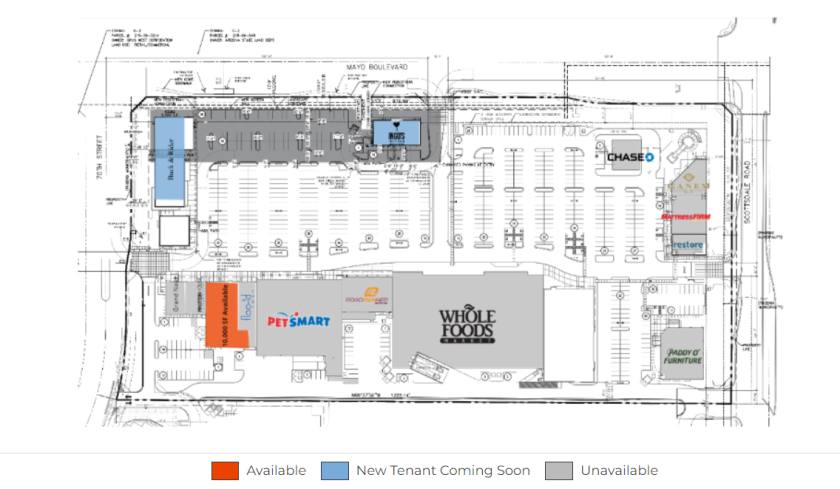
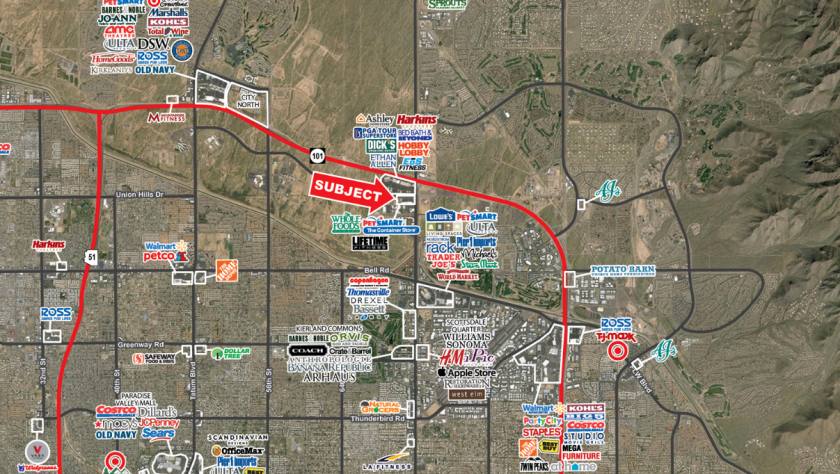
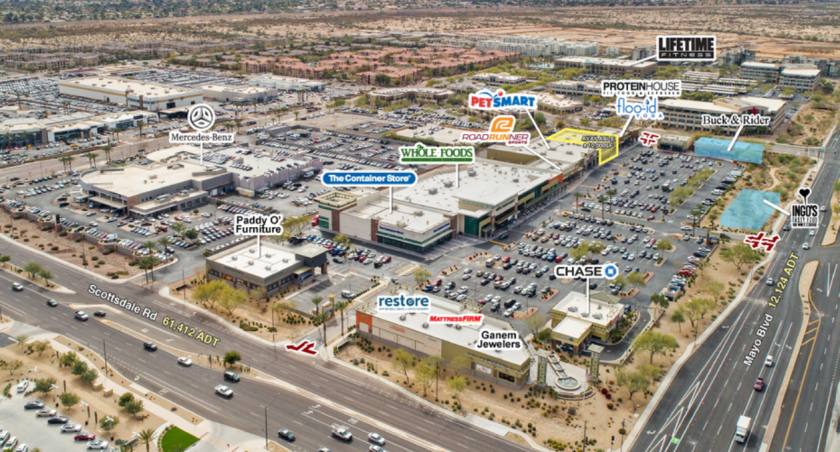
• High Profile Scottsdale Road Whole Foods Anchored Center
• Exceptional Scottsdale Road Center
Additional Photos

Listing Agents

Neil Board
O: 602-778-3781
nboard@w-retail.com
O: 602-778-3781
nboard@w-retail.com

Charles Skaggs
O: 602-368-1737
cskaggs@w-retail.com
O: 602-368-1737
cskaggs@w-retail.com
While we strive to provide the most accurate information, all listing information, and demographic data, is provided by third-parties. As such, MyEListing will not be responsible for the accuracy of the information. It is strongly recommended that you verify all information with the listing agent, and any relevant agencies, prior to making any decisions.