S I T E I S A D J A C E N T T O S T O N E B R I A R
MALL, THE #2 MALL IN DFW BASED
ON SALES VOLUMES
H Y A T T R E G E N C Y H O T E L I S A N 1 8 - S T O R Y ,
$ 1 0 0 M I L L I O N L U X U R Y H O T E L W I T H 3 0 3
R O O M S . I T I S A T T A C H E D T O S T O N E B R I A R
M A L L A N D I N C L U D E S A 2 7 , 5 0 0 S F
C O N F E R E N C E C E N T E R A L O N G W I T H A
F R I S C O P U B L I C L I B R A R Y . R E C E N T L Y
OPENED.
No part of this information may be copied, reproduced, repurposed, or screen-captured for any commercial purpose without prior written authorization from MyEListing.
While we strive to provide the most accurate information, all listing information, and demographic data, is provided by third-parties. As such, MyEListing will not be responsible for the accuracy of the information. It is strongly recommended that you verify all information with the listing agent, and any relevant agencies, prior to making any decisions.
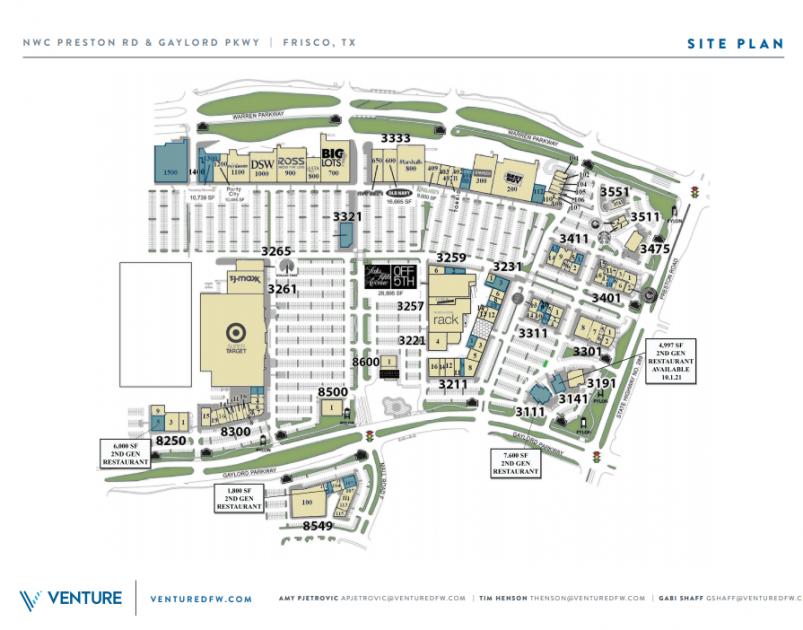
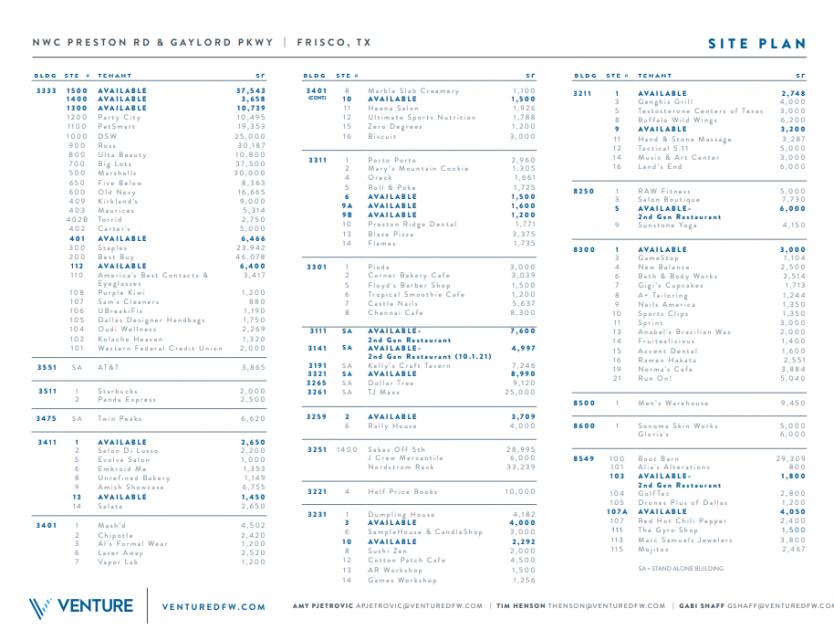
What is the building size of this commercial Retail property?
The size of this multi-unit property varies between 1500 - 10739 square feet
What kind of Retail is the propery at 3201 Preston Road?
The property at 3201 Preston Road Frisco, TX 75034 is listed as a Shopping Center Retail property
What is the population within 1 mile of 3201 Preston Road in Frisco?
The population within 1 mile of 3201 Preston Road Frisco, TX 75034 is 7,101 people.
Who do I contact for questions about 3201 Preston Road?
You should contact the listing agent,
Tim Henson, for any details regarding this commercial listing.