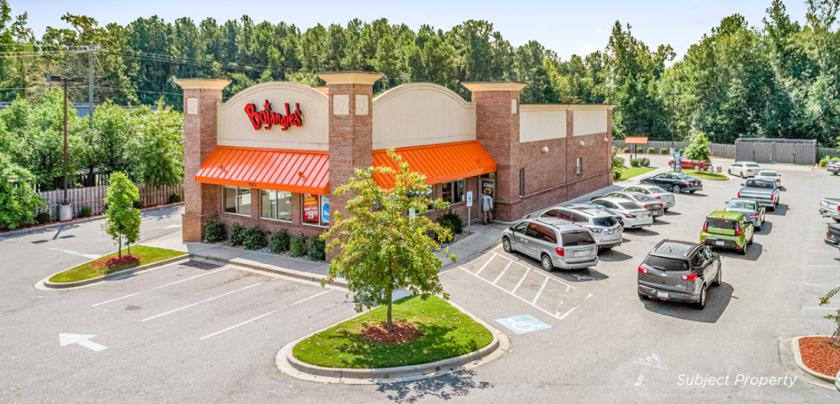
Newer Construction | 2015 Build-to-Suit for Bojangles
9.5 years of Lease Term Remaining | Corporate Guarantee | Bojangles’ Restaurants, Inc
Hedge versus inflation | 1.25% annual rental increases throughout initial term and options
Source of Passive Income | Absolute NNN with no Landlord Responsibilities
Award winning brand | Ranked #2 overall among all brands in the Chicken QSR category by Entrepreneur magazine
Strong growth projections for Bojangles | Announced plans for over 30,000 new hires in the next year to meet demand
Desirable location across from UNC Pembroke’s 281-acre campus | 8,200+ students
Good access and visibility on West 3rd St | Over 18,000 VPD
Located on 3rd Street| Pembroke’s primary retail corridor | Featuring Food Lion, Walmart, Pizza Hut, Car Quest, McDonalds, Circle K, Walgreens, and more
No part of this information may be copied, reproduced, repurposed, or screen-captured for any commercial purpose without prior written authorization from MyEListing.
While we strive to provide the most accurate information, all listing information, and demographic data, is provided by third-parties. As such, MyEListing will not be responsible for the accuracy of the information. It is strongly recommended that you verify all information with the listing agent, and any relevant agencies, prior to making any decisions.
What is the asking price for 901 West 3rd Street in Pembroke?
The asking price for 901 West 3rd Street is $2,165,717
What is the building size of this Retail property in Pembroke, NC?
The size of the building/unit at 901 West 3rd Street in Pembroke is 4,000 square feet
How much land does the Pembroke, NC property at 901 West 3rd Street include?
901 West 3rd Street in Pembroke includes 2.800 acres of land
What kind of Retail is the propery at 901 West 3rd Street?
The property at 901 West 3rd Street Pembroke, NC 28372 is listed as a Free Standing Building Retail property
What is the population within 1 mile of 901 West 3rd Street in Pembroke?
The population within 1 mile of 901 West 3rd Street Pembroke, NC 28372 is 2,404 people.
Who do I contact for questions about 901 West 3rd Street?
You should contact the listing agent,
Sam Young, for any details regarding this commercial listing.